Use the filter to limit your results.


Objectives
Students will know how increased carbon dioxide levels affect temperature and be able to graph and interpret data that demonstrates this relationship.
Overview
Rating:
- Students look at data showing the increase in global carbon dioxide measurements (Mauna Loa).
- Students discuss where carbon dioxide comes from and find out which gas has higher concentrations of carbon dioxide.
- Students complete a lab exercise to investigate the relationship between carbon dioxide and temperature.
- Finally, students create a graph of their results.
Materials
For each group of students:
Activity 1
-five test tubes
-Bromothymol blue solution (BTB)
-ammonia
-1 mL pipette
-cotton ball
-tubing with stopper
-straws
-one balloon filled with car exhaust (optional)
-baking soda
-vinegar
-small square (1” by 1”) of aluminum foil
Activity 2
-2 Ehrlenmeyer flasks
-2 stoppers with holes for 2 thermometers
-200 ml of soda (light-colored)
-200 ml of water
-parafilm
-light source (sun, or lamps)
-graduated cylinder
Procedure
Preparation:
You can use either a powdered or liquid form of BTB to prepare the solution. For the liquid, fill a gallon bottle 9/10 with water and add BTB until the solution is deep blue. For powdered BTB, measure 0.5 g into 500 ml of tap water. This is a 0.1% stock solution. Mix 1 part of the stock solution with 20 parts tap water. One gallon of the solution should be plenty for two class periods of 30 students.
To collect the car exhaust, you will need another adult to help you. Make sure you have enough balloons to fill up all of them at once. Take a manila folder and tape it into a cone. Wear oven mitts or other heat resistant gloves. Blow up and deflate the balloons, this will make them easier to fill with the exhaust. Have an adult turn on the car (in park!). Put the balloon over the small end of the cone. Place the larger end of the manila folder cone over the exhaust pipe; make sure the cone fits securely onto the exhaust pipe. DO NOT use a plastic funnel, as it will melt. A metal funnel can be used but it will get extremely hot, so use protective mitts! One paper cone will work for several fillings without burning. Have your assistant help with twisting the balloon closed; a twist tie works well.
Safety note:
BTB is rated 2 for Health, 1 for Flammability, and 0 for Reactivity. It is a relatively safe substance, but must be handled carefully! As with all chemicals, be sure to read the MSDS before using. BTB is very hazardous if swallowed and can cause irritation to the eyes and/or skin. In case of eye contact, flush with plenty of water for at least 15 minutes. Contact physician. If skin irritation occurs, flush affected area thoroughly with water. If swallowed, give large quantities of water and contact a physician. To dispose of the solution, pour down the drain while allowing cold water to run. Flush system for 5 minutes with cold water. BTB is flammable and shouldn’t be used near hot plates or flames. Empty containers should be allowed to thoroughly dry under a fume hood. **Students should wear goggles and gloves when handling.
Be very cautious with car exhaust, as it contains carbon monoxide, a toxic and potentially lethal substance.
Engage:
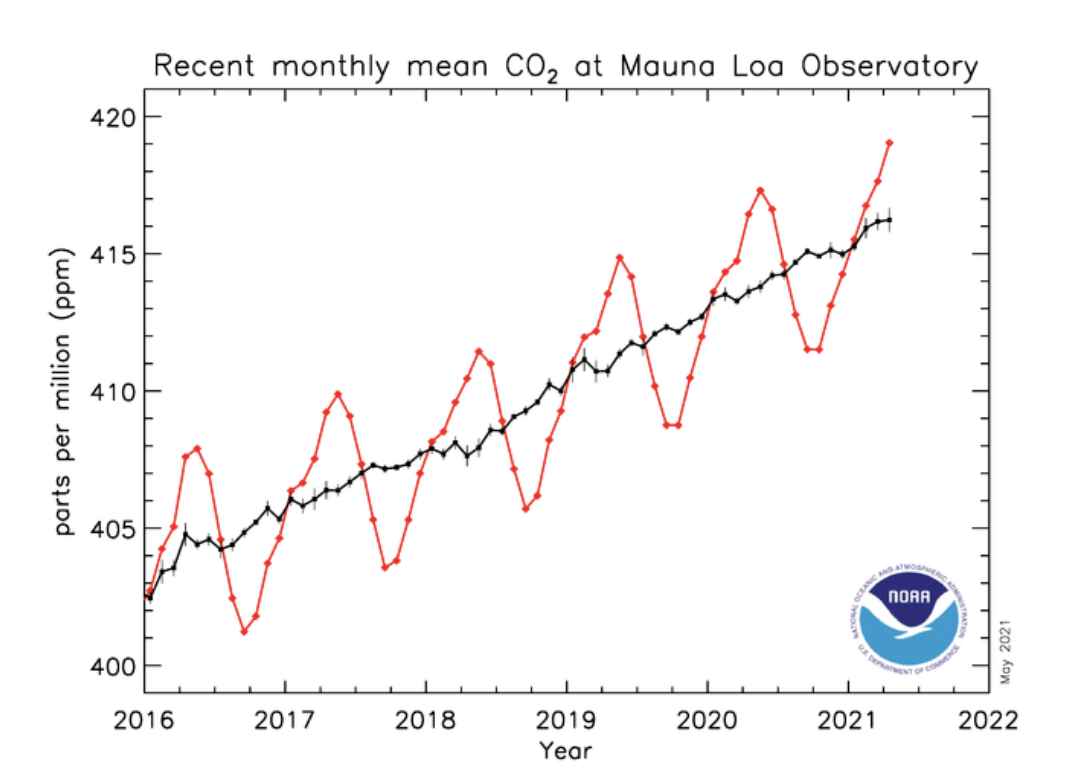
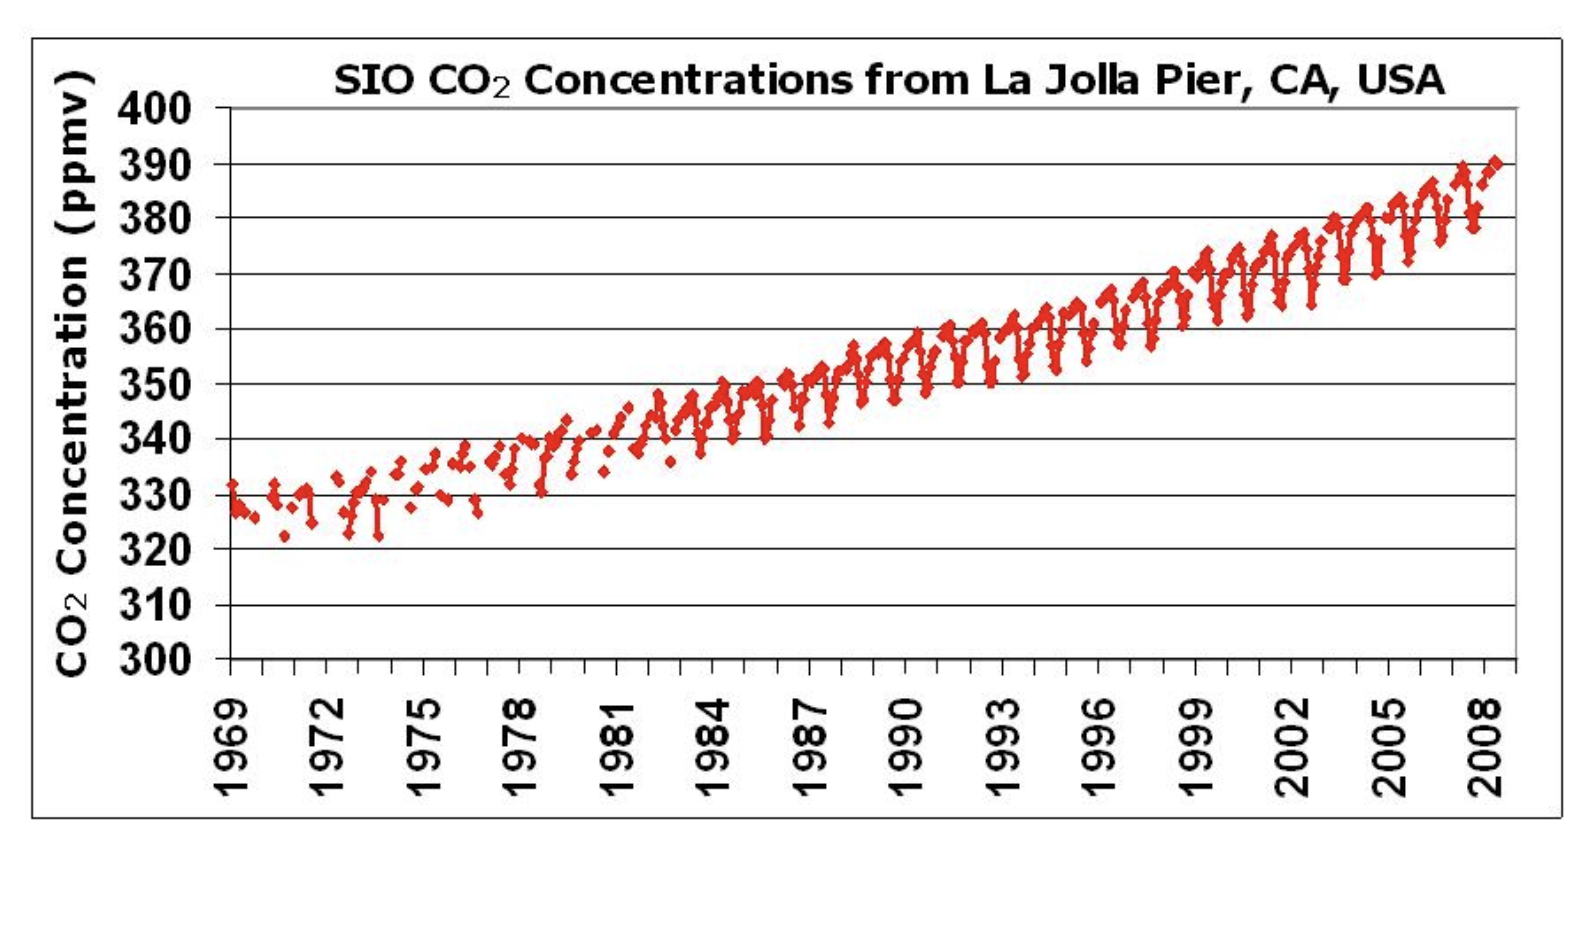
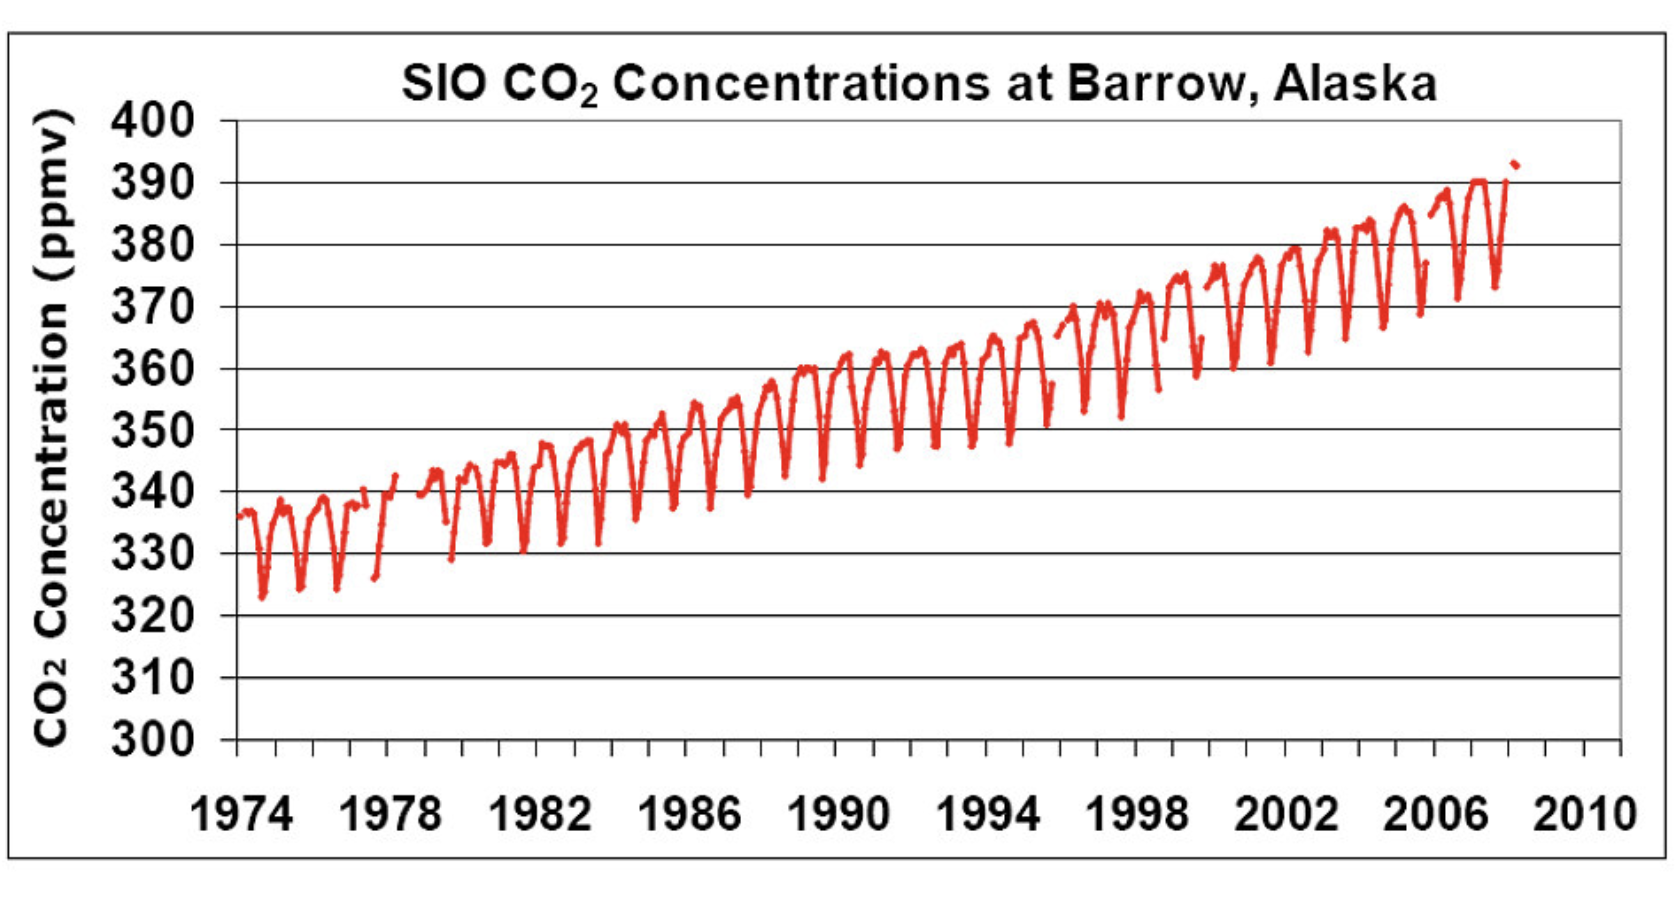
Show students the graph of Mauna Loa, and explain the background of the monitoring station. In 1955, Dr. Keeling started monitoring the carbon dioxide levels in the atmosphere at Mauna Loa, a monitoring station in the middle of the Pacific Ocean. While some people are skeptical about the Mauna Loa data because the site is on a volcano, you can explain to students that any volcanic activity is accounted for when scientists take a measurement, besides the fact that it is not an active volcano. (A monitoring station on an active volcano would be asking for trouble!) There are numerous other sites in the global CO2 monitoring network, including: La Jolla Pier, Barrow, Alaska, and Christmas Island, among others.
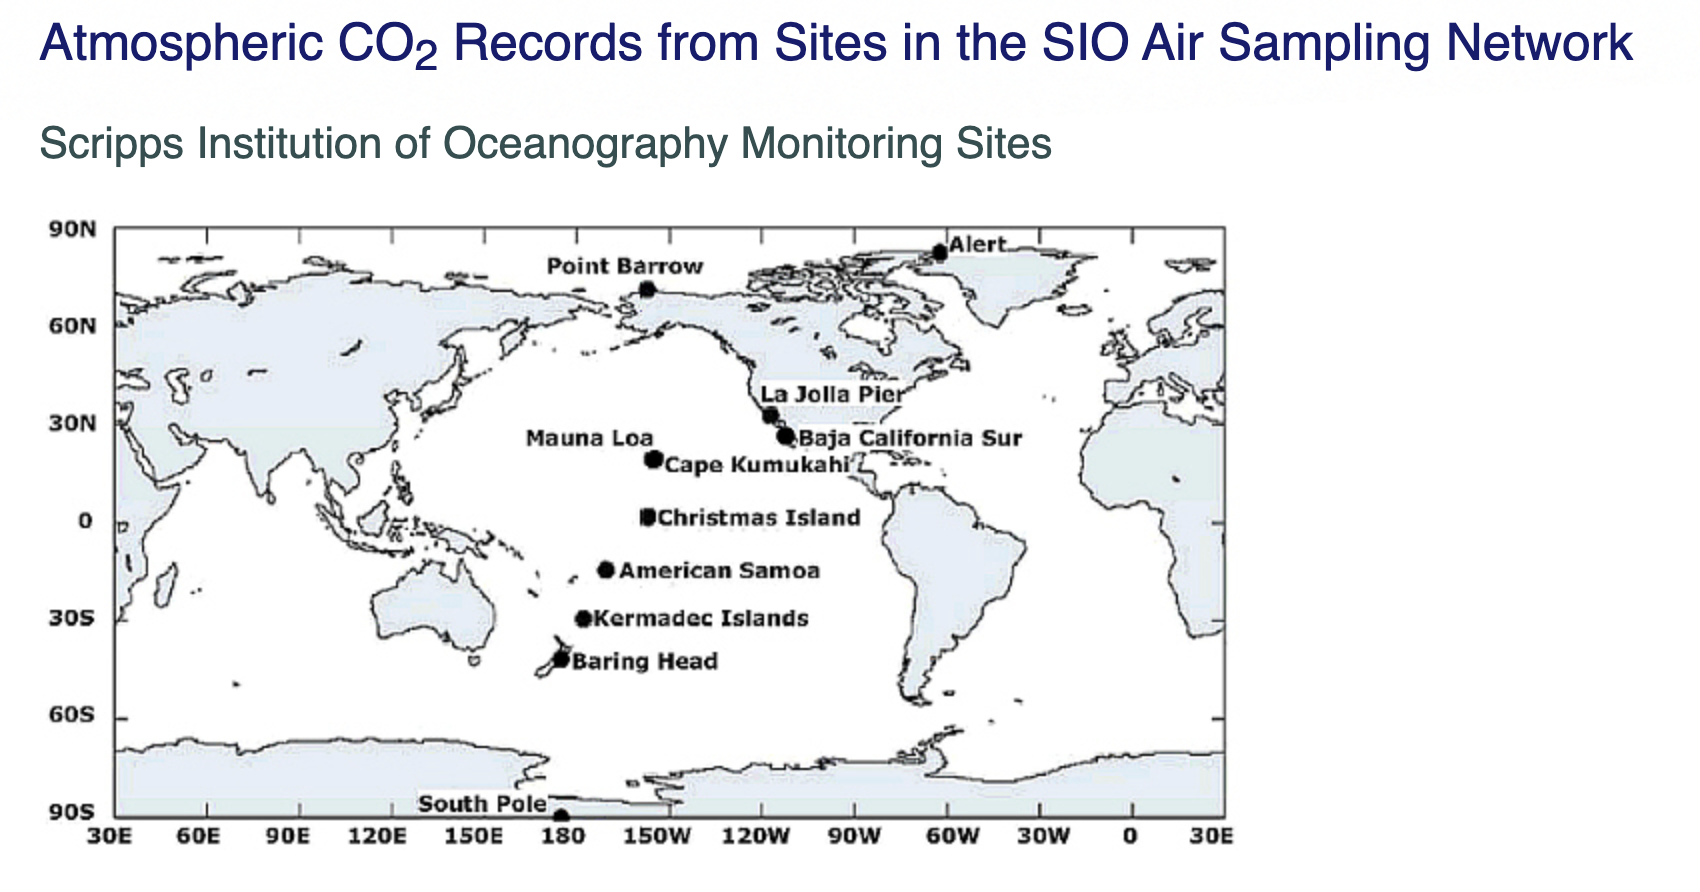
Image source: https://cdiac.ess-dive.lbl.gov/trends/co2/sio-keel.html
Ask students: What causes the yearly fluctuations in the graph? (Answer: photosynthesis and respiration on a global scale as seasons change). Keep in mind that Mauna Loa, La Jolla, and Barrow are all in the northern hemisphere and thus demonstrate the patterns of respiration and photosynthesis only in the north. If this is a difficult concept, use the graph showing 5 days of dissolved oxygen changes in the Hudson River and remind students about these processes.
Ask: What has happened to the overall CO2 levels around the world? Why?
Explore:
Activity 1: This activity asks students to test for the presence of carbon dioxide in different gases. Students will test the carbon dioxide levels in exhaled breath, ambient air, car exhaust, and vinegar with baking soda. Give each student a balloon with car exhaust. Students will gather the other materials as listed on their lab sheet, and follow the directions. The final step is to titrate the solutions back to blue using ammonia. This will give students an understanding of which type of gas has higher levels of carbon dioxide. Although you can use a regular plastic pipette or eye dropper, it is more precise if you use a 1 mL pipette. If using a regular pipette, have the students add one drop at a time. The tube with exhaled breath will return to blue after one drop, the car exhaust after two, and the baking soda/vinegar after four. Students should swirl the tubes after each addition and wait for the color to settle—the car exhaust and baking soda/vinegar solutions will turn blue when a drop is first added and then turn back to yellow when mixed.
Activity 2: Students will perform an experiment that will use two flasks, one with water and one with soda (preferably ginger ale or another light-colored soda).
Set-up: Each flask needs to have a stopper with a hole in the middle for a thermometer. Place 200 ml of water in one flask, and 200 ml of soda in the second flask. Heat both flasks in a microwave for 15-20 seconds, just to get them to the same temperature (or, leave the water and soda out at room temperature overnight). Stopper the flasks and seal them with the parafilm. Place the flasks in front of a light source for 10-15 minutes. Sunlight works as well. Students observe and write down the temperature difference between the two flasks.
Explain:
Global levels of carbon dioxide have been increasing steadily since the Industrial Revolution as a result of human activities. Carbon dioxide and temperature are related, and the two often fluctuate in tandem. Sometimes, carbon dioxide lags behind temperature, and sometimes it leads temperature. For instance, scientists believe that the last ice age ended because a change in Earth’s orbit increased temperatures, which were then reinforced by the changing carbon dioxide levels. As temperature increased, release of carbon dioxide and methane increased from permafrost and wetlands, creating a positive feedback loop. Burial of carbon or ocean absorption caused the ‘brakes’ to be applied. Most research suggests that shifts in temperature are related to Milankovich cycles. Milankovitch linked the changes in earth’s orbit to the advance and retreat of the polar ice caps. There are three types of changes in Earth’s movement: eccentricity, axial tilt (or obliquity), and precession. Earth is tilted at an angle, which, along with its position of orbit determines the seasons and longer climatic patterns. Earth’s tilt does not remain constant, due to the gravity of nearby larger planets, and varies from 22.2 to 24.5 degrees over a 41,000 year cycle (called the obliquity cycle). Earth’s elliptical path changes on a 100,000 year eccentricity cycle. Earth also wobbles on its titlted axis, taking about 22,000 years to complete one revolution (called precession). This wobble (or precession) is thought to control the cycle of the monsoons.
During the past 2000 years, concentrations of CO2 have remained between 270 and 290 ppm, except since the Industrial Revolution. The rise in CO2 during the past 150 years is associated with global warming, and the most recent projections from the intergovernmental panel on climate change (IPCC, 2007) are for levels reaching 500 ppm in 2050 and > 700 ppm by 2100. Current CO2 levels are 396 ppm.
Extend:
1) As a class, visit: (https://gml.noaa.gov/ccgg/trends/mlo.html) to see recent NOAA CO2 trends and the most up-to-date readings from Mauna Loa.
2) Have students measure the pH of the solutions as they are testing for carbon dioxide concentrations, as this will change depending on the amount of acidity in the solution. Acidification of the oceans as a result of increased CO2 levels is a serious problem with global consequences.
3) Students could design additional experiments that investigate the relationship between temperature and carbon dioxide. Some ideas include measuring different types of soda, or flat versus new soda, or additional types of gases in the first activity (such as from different types of cars, etc).
Evaluate:
Assess student understanding by their answers from the lab sheets.
Comments:
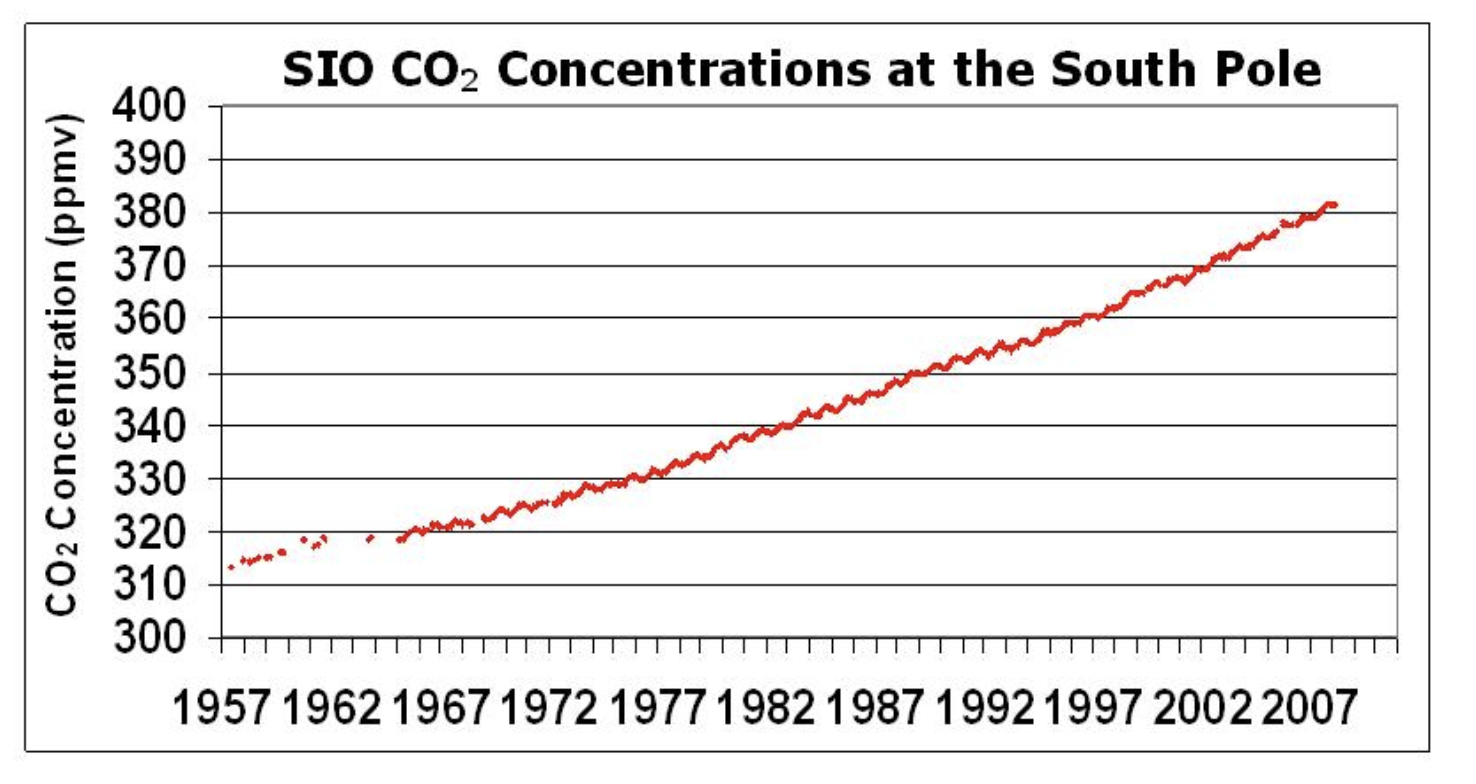
Recent CO2 data from several observatories are shown below. Additional CO2 data from other observatories is available here: http://cdiac.ornl.gov/trends/co2/sio-keel.html (http://1.usa.gov/10IT2Ss).
References:
Dr. Pieter Tans, NOAA/ESRL (www.esrl.noaa.gov/gmd/ccgg/trends/) and Dr. Ralph Keeling, Scripps Institution of Oceanography (scrippsco2.ucsd.edu/).
Keeling, R.F., S.C. Piper, A.F. Bollenbacher and J.S. Walker. 2008. Atmospheric CO2 records from sites in the SIO air sampling network. In Trends: A Compendium of Data on Global Change. Carbon Dioxide Information Analysis Center, Oak Ridge National Laboratory, U.S. Department of Energy, Oak Ridge, Tenn., U.S.A.
Keeling, R.F., S.C. Piper, A.F. Bollenbacher and J.S. Walker. 2008. Atmospheric CO2 records from sites in the SIO air sampling network. In Trends: A Compendium of Data on Global Change. Carbon Dioxide Information Analysis Center, Oak Ridge National Laboratory, U.S. Department of Energy, Oak Ridge, Tenn., U.S.A.
Keeling, R.F., S.C. Piper, A.F. Bollenbacher and J.S. Walker. 2008. Atmospheric CO2 records from sites in the SIO air sampling network. In Trends: A Compendium of Data on Global Change. Carbon Dioxide Information Analysis Center, Oak Ridge National Laboratory, U.S. Department of Energy, Oak Ridge, Tenn., U.S.A.
Resources
Lesson Files
pdf
Student CO2 lab sheet
Standards
Benchmarks for Science Literacy
1B Scientific Inquiry, 4B The Earth, 4G Forces of Nature, 5E Flow of Matter and Energy, 9D Uncertainty, 11C Constancy and Change, 12D Communication SkillsNYS Standards
MST 1 - Mathematical analysis, scientific inquiry, and engineering design, MST 4- Physical setting, living environment and nature of science, MST 6- Interconnectedness of mathematics, science, and technology (modeling, systems, scale, change, equilibrium, optimization), MST 7- Problem solving using mathematics, science, and technology (working effectively, process and analyze information, presenting results)Credits
Activity 1 is modified from a Windows to the Universe activity:
Windows to the Universe team. “Carbon Dioxide -- Sources and Sink.” 2010. National Earth Science Teachers Association, in conjunction with the University Corporation for Atmospheric Research. http://bit.ly/YRgFIu
IPCC, 2007: Climate Change 2007: Synthesis Report. Contribution of Working Groups I, II and III to the Fourth Assessment Report of the Intergovernmental Panel on Climate Change [Core Writing Team, Pachauri, R.K and Reisinger, A.(eds.)]. IPCC, Geneva, Switzerland, 104 pp.