Use the filter to limit your results.


Objectives
Students will know how land use affects water quality and be able to compare water quality in two different aquatic ecosystems.
Overview
Rating:
- Students determine which aquatic ecosystems to study (one with 0-10% impervious surfaces, and one with more than 30% impervious surface) and create hypotheses about their water quality based on observed land use.
- Students obtain aerial photos of the study site, and/or conduct a land use survey on foot.
- Students complete water quality study at two different sites, compile and discuss results.
Materials
- Metersticks
- Measuring tape
- Thermometers (air and water)
- Ping pong or tennis ball
- Stopwatch
- Waders or appropriate shoes
- Dissecting trays, tweezers, nets to observe benthic material (optional)
- Test kits for DO, phosphates, nitrates, pH, chloride and other appropriate tests
- Goggles, gloves
- Data sheets-separate sheets for ponds/lakes, streams/rivers, macroinvertebrates and water chemistry
Procedure
Prepare:
Based on students’ familiarity with the equipment, you may want to do a practice run in the classroom with water samples from a stream. This will allow students to practice using the chemical test kits, and give everyone time to think through their hypotheses.
You should also decide whether you want to include macroinvertebrates in your survey. Use the collection techniques in the lesson titled “An Aquatic Ecosystem” in “The Hudson Valley: A Social- Ecological System” unit.
Finally, if you haven’t covered watersheds or water quality yet, you may consider either beginning or following up with the “Watersheds” lesson from the “Natural History of the Hudson River” unit and/or the “Introduction to Water Quality” lesson in the “Water Quality & Health” unit.
Engage:
- Ask students to come up with ways that different streams might be impacted by land use.
- With teacher guidance, students should decide which watersheds they would like to compare. The two sites should be different enough to provide comparison, with one site less than 10% impervious surface, and the second site more than 30% impervious. Sites can also be chosen to compare agriculture vs other land uses. Sites should be easy to get to, and students should obtain aerial photos from a service like Google Earth to determine the amount of impervious surface using the grid method outlined in lesson 5 of Module 4, “School Water Budget.” If aerial photos are not available, students could conduct a basic land use survey on foot. Students should construct hypotheses before going to the study site.
Explore:
- In groups, students test the water quality and make observations about the physical and biological characteristics of the study site. Based on the size of your class, you may want to assign groups different variables to test.
- All students should do a detailed site drawing, including a diagram showing the surrounding land use. If possible, return to the stream a few times to collect more data.
- We recommend following the procedures listed in the Hudson Basin River Watch document, which can be found at https://catskillstreams.org/pdfs/guidancedoc.pdf Other ideas for comparison include vegetation around or in the water body, diversity of organisms observed at the sites (salamanders, birds, insects, etc), or soil chemistry.
- While students are writing up their lab reports, they are asked to think about the difference between a ‘bend’ and a ‘break’ in an ecosystem (a temporary vs a permanent change). If this is a difficult concept for students, spend some time discussing what this might mean for a stream versus a larger ecosystem such as a river. Ask students to classify different environmental problems as ‘bends’ or ‘breaks’. A hurricane might cause a break, while sea level rise could be classified as a bend.
Explain:
After you return to the classroom, discuss student findings. What did students notice? If students collected macroinvertebrates, discuss the connections between the organisms that live in/near the aquatic ecosystem with the land use in the ecosystem’s watershed.
Suburban watersheds have high levels of nitrogen, although these levels are generally lower than agricultural watersheds. The major inputs for suburban watersheds are atmospheric deposition and home lawn fertilizer use. As areas become more urban or more forested, nitrogen inputs decline, especially from fertilizer use. However, urban watersheds often have inputs from sewage and/or pet waste that are difficult to quantify because they occur after a precipitation event or are very localized. Students use data from the table below to think about how land use affects water quality in different types of watersheds, and whether their data are supported by the results shown below.
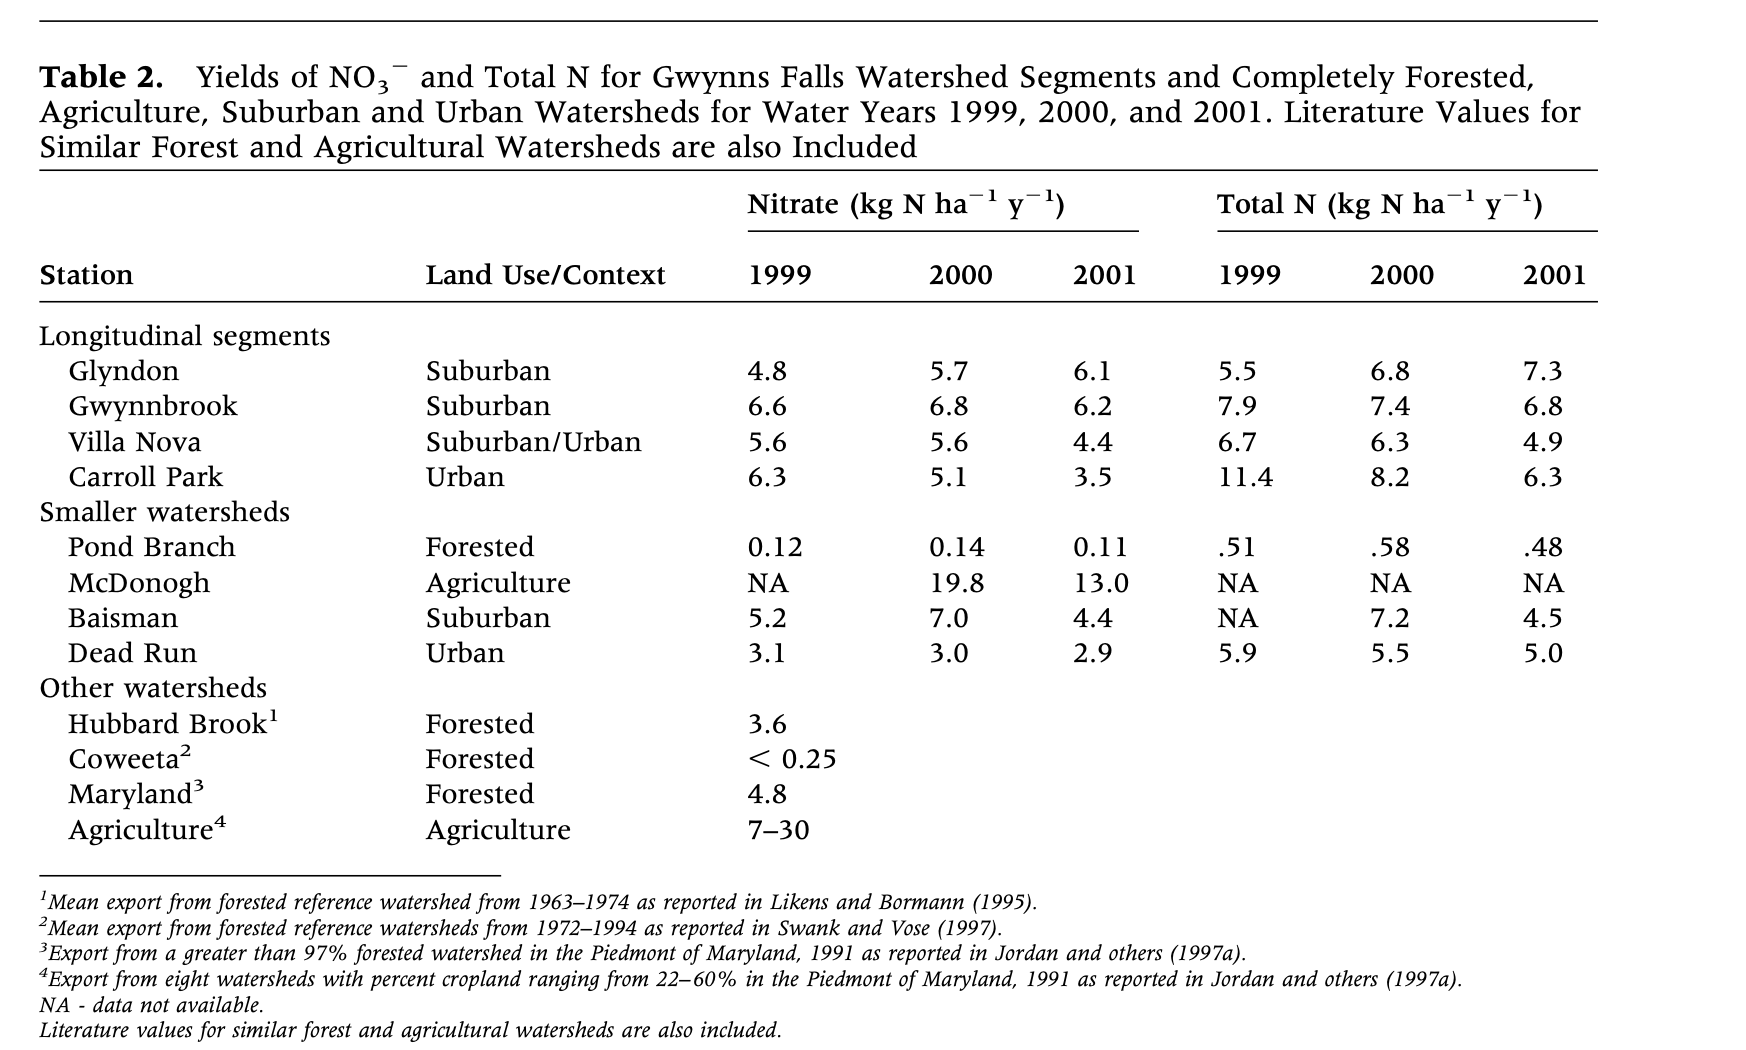
Data from: Groffman, P., Law, N., Belt, K., Band, L., and G. Fisher. 2004. Nitrogen Fluxes and Retention in Urban Watershed Ecosysetms. Ecosystems 7:393-403.
In a major study of 35 large rivers around the world, researchers Caraco and Cole found that human activity was the main control of nitrate export. Human activity refers to fertilizer and the use of motor vehicles. Caraco and Cole also found a strong relationship between population density and nitrate export, proving that humans are the main cause of increased nitrogen in the rivers.
Students are also asked to think about the relationship between pervious surfaces and water quality, and to compare their results with the diagram and definitions below. This should generate some discussion about what the definitions mean, and whether they are accurate.
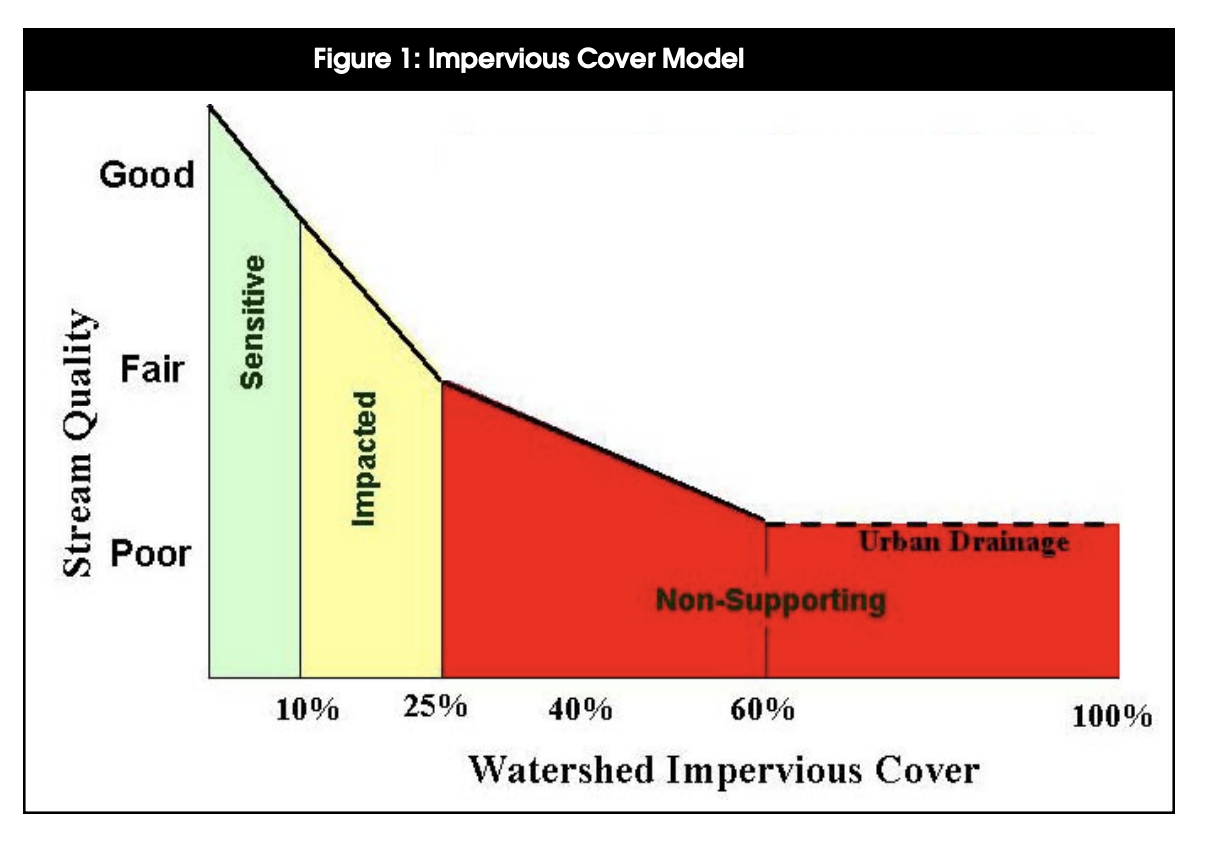
Figure shown is Figure 1 from “The Impervious Cover Model.” The Center for Watershed Protection (http://www.cwp.org; Formerly Stormwater Center): http://bit.ly/18c9bk5
The model classifies streams into one of three categories: sensitive, impacted, and non-supporting. Each stream category can be expected to have unique characteristics as follows:
Sensitive Streams. These streams typically have a watershed impervious cover of zero to 10 percent. Consequently, sensitive streams are of high quality, and are typified by stable channels, excellent habitat structure, good to excellent water quality, and diverse communities of both fish and aquatic insects. Since impervious cover is so low, they do not experience frequent flooding and other hydrological changes that accompany urbanization. It should be noted that some sensitive streams located in rural areas may have been impacted by prior poor grazing and cropping practices that may have severely altered the riparian zone, and consequently, may not have all the properties of a sensitive stream. Once riparian management improves, however these streams are often expected to recover.
Impacted Streams. Streams in this category possess a watershed impervious cover ranging from 11 to 25 percent, and show clear signs of degradation due to watershed urbanization. The elevated storm flows begin to alter stream geometry. Both erosion and channel widening are clearly evident. Streams banks become unstable, and physical habitat in the stream declines noticeably. Stream water quality shifts into the fair/good category during both storms and dry weather periods. Stream biodiversity declines to fair levels, with most sensitive fish and aquatic insects disappearing from the stream.
Non-Supporting Streams. Once watershed impervious cover exceeds 25%, stream quality crosses a second threshold. Streams in this category essentially become conduits for conveying stormwater flows, and can no longer support a diverse stream community. The stream channel becomes highly unstable, and many stream reaches experience severe widening, downcutting, and streambank erosion. Pool and riffle structure needed to sustain fish is diminished or eliminated and the substrate can no longer provide habitat for aquatic insects, or spawning areas for fish. Water quality is consistently rated as fair to poor, and water recreation is no longer possible due to the presence of high bacterial levels. Subwatersheds in the non-supporting category will generally display increases in nutrient loads to downstream receiving waters, even if effective urban BMPs are installed and maintained. The biological quality of non-supporting streams is generally considered poor, and is dominated by pollution tolerant insects and fish.
Extend:
Students create a presentation of their research for community members or another audience within the school, and discuss ways of improving water quality through land use change or specific mitigation strategies (pervious asphalt, rain gardens, riparian zones, etc).
Evaluate:
Students turn in the completed data sheets, along with a lab report. Students should be able to explain how land use affects water quality using evidence from their investigation.
Resources
Lesson Files
pdf
Student lab report
pdf
Chemical Test Data Sheet
pdf
Macroinvertebrates Data Sheet
pdf
Ponds Data Sheet
pdf
Streams Data Sheet
pdf
Macroinvertebrate Collection SheetStandards
Benchmarks for Science Literacy
1B Scientific Inquiry, 2A Patterns and Relationships, 4B The Earth, 4G Forces of Nature, 5A Diversity of Life, 5D Interdependence of Life, 11C Constancy and Change, 12B Computation and Estimation, 12D Communication SkillsNYS Standards
MST 1 - Mathematical analysis, scientific inquiry, and engineering design, MST 4- Physical setting, living environment and nature of science, MST 6- Interconnectedness of mathematics, science, and technology (modeling, systems, scale, change, equilibrium, optimization)Credits
References:
Groffman, P., Law, N., Belt, K., Band, L., and G. Fisher. 2004. Nitrogen Fluxes and Retention in Urban Watershed Ecosysetms. Ecosystems 7:393-403.
Environmental Indicators Worksheets. Center for Watershed Protection. Retrieved 4/22/2008 at www.stormwatercenter.net
Behar, S. and M. Cheo. 2004. Hudson Basin River Watch Guidance Document. River Network. https://catskillstreams.org/pdfs/guidancedoc.pdf