Air Pollution Trends in the USA data
You can also explore this dataset on TUVA, an interactive graphing platform.
Background
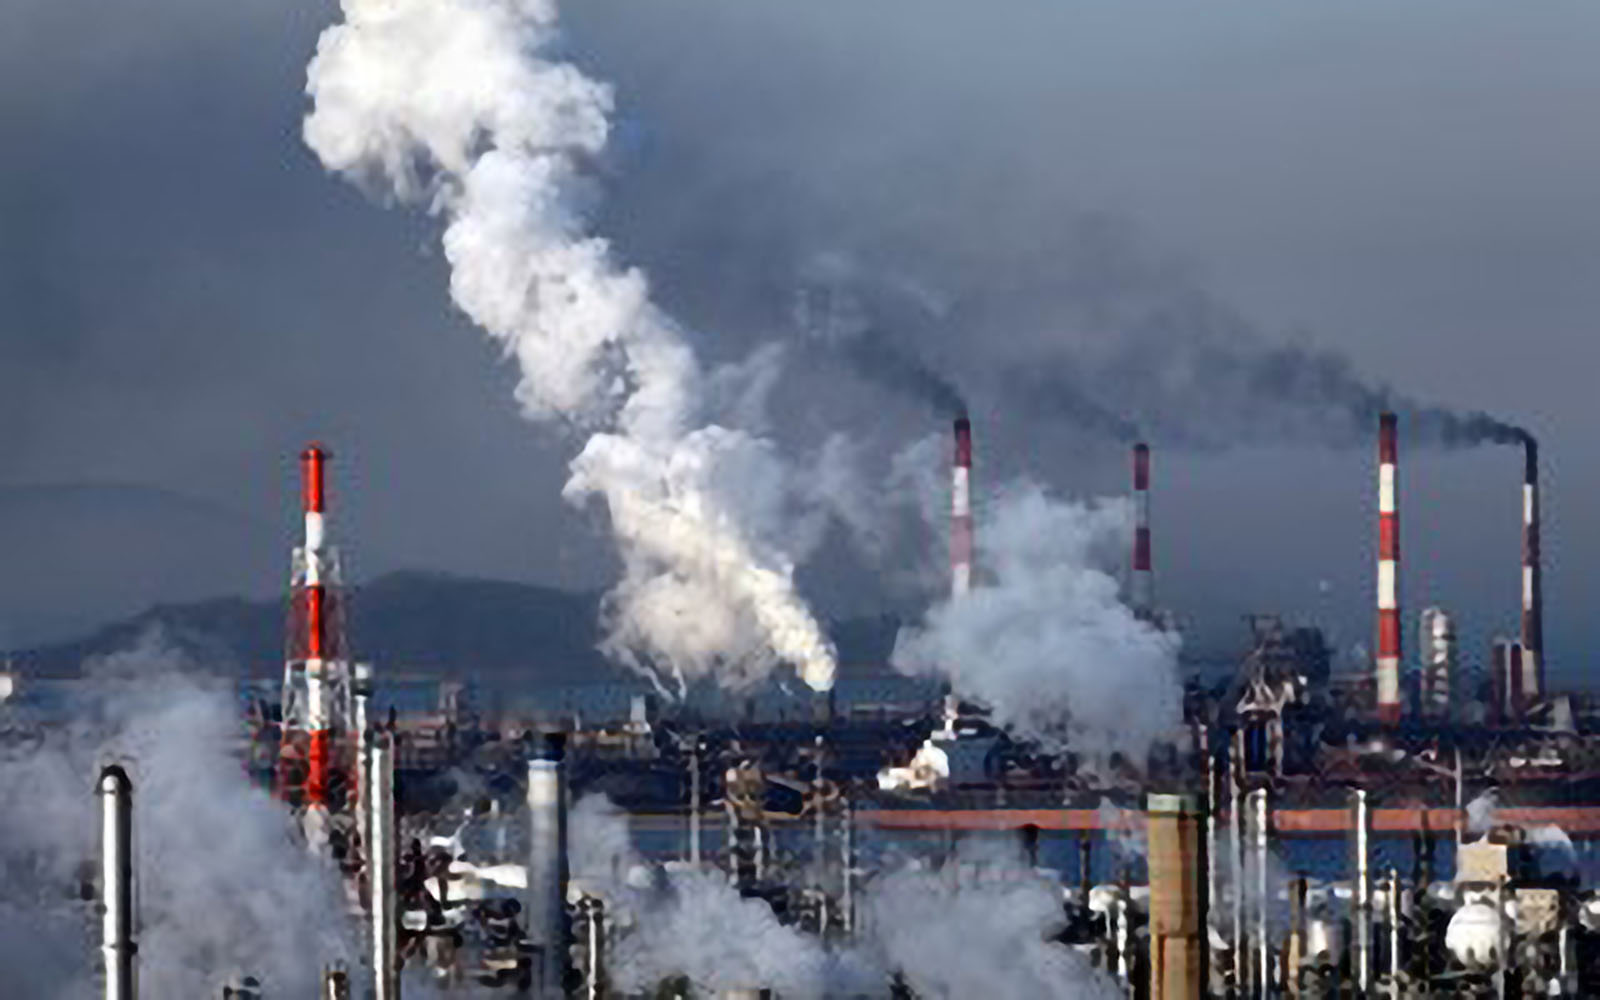
Air quality refers to the health and safety of the atmosphere and is determined based on the amount of pollutants in the air. Air pollutants include compounds such as volatile organic compounds (VOCs), carbon monoxide (CO), ozone (O3), sulfur dioxide (SO2), nitrogen dioxide (NO2), gaseous lead (Pb), and particulate matter (PM2.5 and PM10). These compounds make up less than 1% of the atmosphere, yet they are very important to making sure we and our environment are healthy. The average adult breathes over 3,000 gallons of air every day, and it matters what is in the air we breathe.
In this dataset, students can explore how air pollution has changed over time in the USA and in New York.
Data Sampling & Compilation
Data Sources: Environmental Protection Agency (EPA) and U.S. Census Bureau
Prepared by: Lauren Shulman (Eximius College Preparatory Academy) and Michelle Vehlo (Hudson Montessori School)