Use the filter to limit your results.


Objectives
Students will collect diatom samples and compare diatom communities from their sampling site with salinity levels.
Overview
Rating:
Students form hypotheses about the type of diatoms they expect to see in different parts of the Hudson River, and near their school.
Students collect and identify key genera of freshwater and marine diatoms near their school, and analyze communities to see if they match their hypotheses.
Materials
Powerpoint presentation Modeling Interaction of Salinity & Diatoms
String and/or microplankton net and/or toothbrush and plastic tray
Airtight glass bottles
Permanent marker for labeling samples
Diatoms & Hudson Estuary water samples
Lugol’s solution (no digestion), or hydrogen peroxide, drain cleaner, bleach, or other oxidizing agent
Compound light microscopes
Microscope slides (concave and flat)
Coverslips
Plastic pipettes
Diatoms of the Hudson River cards (especially useful if students don’t have access to samples, microscopes, drawings etc.)
Student worksheet Identifying Diatoms
NOTE: if students are working in Google docs directly, they will first need to make a copy of the worksheets with their last name in the filename.
Procedure
Day 2:
Engage:
Ask students:
Q. What kind of a role do phytoplankton play in the aquatic food web. Are they producers, consumers, or decomposers? A. They are primary producers, producing food (in the form of glucose) for primary and secondary consumers, as well as decomposers through the process of photosynthesis. They also produce oxygen as a byproduct of photosynthesis.
Introduction:
A Google Slides presentation, Modeling the interaction of salinity and diatom populations in the Hudson Estuary accompanies this section and should be helpful in identifying the various algae, most of which are diatoms.
The Hudson Estuary contains floating communities of phytoplankton, comprised of algae and other tiny photosynthetic organisms. Bacilliariophyta or diatoms are the dominant algae, especially in the winter when other phytoplankton populations are low (Stanne, 2007).
Diatoms have transparent silica cell walls (called frustules) that are formed in two pieces which fit together like a pillbox. Silica is the main component of glass, so diatoms are often referred to as “algae in glass houses.”
Because most diatoms are very sensitive to abiotic factors such as salinity, dissolved oxygen, pH, and temperature, they are often used as environmental indicators. Frustules do not decompose so they can be found in freshwater and saltwater sediments, providing information about historical conditions of the river (Diatoms of North America). Changes in diatom population size can reflect a change in a food web, as is the case with the boom and bust cycles of zebra mussels and diatom depletion and resurgence (Strayer, 2016). Salinity levels are known to impact phytoplankton growth and distribution in brackish waters, and may be particularly altered as a result of climate change (Floder, 2010).
Ask students:
Q. Can you think of other ways in which diatoms may be environmental indicators in the Hudson Estuary? Hint: Which abiotic factors might impact their presence in certain locations in the estuary? A. Tides, the amount of rainfall, temperature, and pH are abiotic factors that can influence diatom presence and location. The presence of certain benthic diatoms (freshwater vs saltwater) deep in the sediment layers of the river can be studied to infer weather patterns. These samples are collected by taking core samples (similar to core samples used in A day in the life of the Hudson).
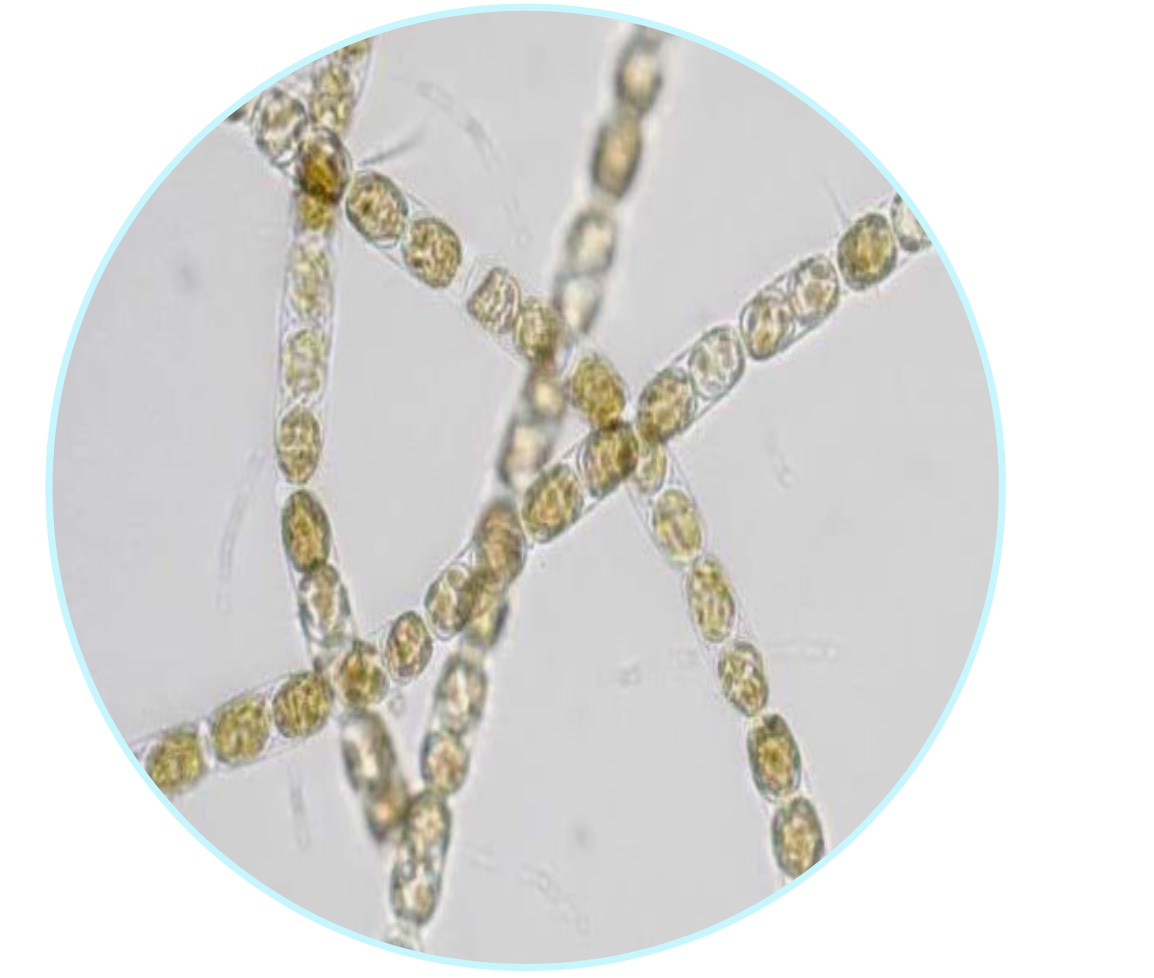
Although diatom populations peak in early summer and fall, cyanobacteria such as Anabena are more abundant. In the winter months, diatoms dominate the phytoplankton community so are much easier to find.
Three representative diatom populations commonly found in the Hudson River Estuary are:
Paralia sulcata (formerly Melosira sulcata) prefers salt to brackish waters
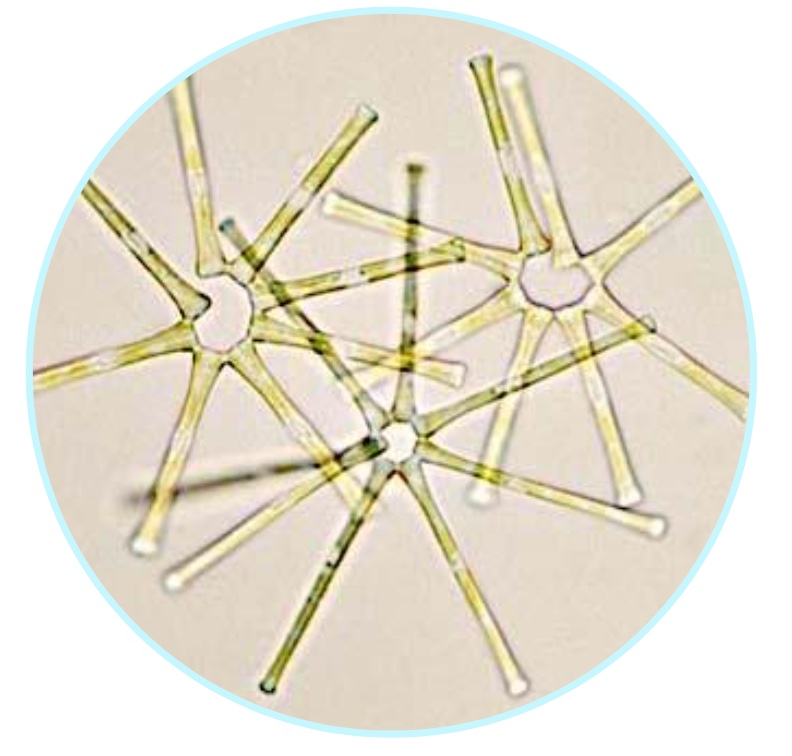
Asterionella formosa prefers fresh to brackish waters
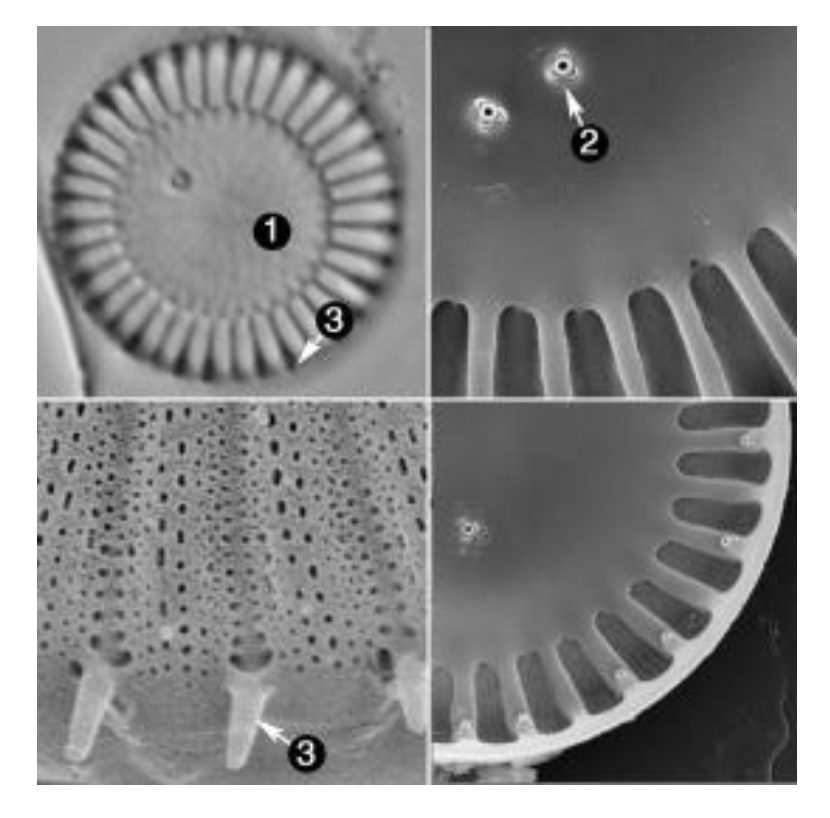
Cyclotella are found inbrackish to marine habitats throughout the Estuary.
A couple other common species are on the Diatom and Algae ID Cards.
Ask students:
Q. Where would you expect to find these diatoms in the Hudson Estuary? Place diatom cards on the appropriate location on the map model. A. Most Cyclotella are marine so would be close to NY Harbor but some (e.g. Cyclotella meneghiniana in Constitution Marsh RM 55) can be found in far less salty conditions. Asterionella prefers fresh to brackish waters.
This process can be extended to include simulating various scenarios e.g. drought, flooding using all of the diatom population cards, especially if diatom samples and/or microscopes are not available.
Focusing on the five species on the Diatom ID Cards, have students write a hypothesis about the relative abundance (the percent of the diatom community) for diatoms at their sampling site.There are two variables that students should consider: the salinity of the habitat, or the type of habitat (planktonic or benthic).
Once students have a hypothesis, have them make a data table that they will use to collect their data. An example data table can be found here.
Sampling is done differently for planktonic and benthic diatoms, so you may want to decide which method you are using ahead of time, or allow the students to compare planktonic and benthic communities. Note: if you are planning to use the string method to collect planktonic diatoms (see Day 3 below), you will need to set it up a few days in advance. You could take students out to the field to set it up at the beginning of Day 1, or set it up without students before beginning the lesson.
There are two primarily marine taxa; Cyclotellaand Paralia, and three brackish-fresh taxa; Navicula, Asterionella, and Cocconeis. Based on the salinity of your sampling location, students can make predictions about what diatoms they will see in their samples.
If your classroom does not have access to a sampling site (pond, creek, Hudson River, etc.), you can have students look at permanent diatom slides from freshwater or marine environments and draw what they see. If you are short on time, you can collect and prepare the samples ahead of time.
Day 3:
Explore:
Collecting, identifying, recording, and mapping diatoms in the Hudson Estuary
Note on collecting diatoms in the Hudson Estuary: Although diatom populations peak in early summer and fall, cyanobacteria such as Anabena are more abundant at that time. In the winter months, diatoms dominate the phytoplankton community so are much easier to find. For that reason, February is often the best month in which to collect diatoms.
Begin by having students review their hypothesis from Day 2 about the diatoms they expect to see. Then, take students out to the field site and use one of the methods below to collect diatom samples.
Planktonic diatom sampling:
String Method: Secure one end of a foot long piece of string on the bank of the water body, so that the length of the string is drifting in the water. You can use rocks or other materials to secure the string. Let the string drift in the water for several days as the diatoms attach to the string. After diatoms have attached to the string, take it out of the water and put it and a small amount of Hudson River water in a jar labeled with the collection date and location.
2 liter bottle: fill the bottle with water from the surface of the water body. Label it with the location and date.
Microplankton net: Use a specially designed net that filters out all but phytoplankton to collect planktonic diatoms. Drag the net back and forth just below the surface of the water for a few minutes. A net with a mesh size of no more than 25 micrometers (um) will collect diatoms. Place contents in a jar and label it with the collection date and location.
Benthic diatom sampling:
Toothbrush Technique: Collect golden brown- black layers from rocks and plants close to shore with a toothbrush, and store in airtight glass jar with a little Hudson River water. Try to avoid collecting sand with the samples. Label each jar with date and location of sample.
Preparing diatom samples
Living diatoms, especially benthic diatoms that are mobile, are interesting to view under the compound light microscope, however, it is easier to identify and count the samples when they are not alive. Collected samples can be divided so that some are observed as living samples and others can be further processed for viewing to identify them by their distinct frustules.
Separate a small amount of the collected sample and use for viewing under the microscope alive.
Option 1: Add Lugol’s iodine solution to remaining collected samples and allow the organisms to settle to the bottom over 16-24 hours (Taylor, 2007).
Option 2: If you would like to digest the organic material out of the samples in order to better see the frustules, follow the steps below. Note: This will add 1-5 days between collection and viewing, depending on if you have access to a centrifuge or not.
Separate a small amount (~0.1g) of the solid material from the sample into 50mL centrifuge tubes.
Add 5mL of 30% H2O2 to the tubes and let the samples sit overnight in a room temperature water bath. If you are involving students in this step, they should wear gloves, goggles, and lab coats, as 30% H2O2 is a powerful oxidizing agent. Other oxidizing agents that can be used include 20% bleach, or a drain cleaning solution, and the same precautions should be observed. See the video on slide preparation for a demonstration.
After digestion, rinse the samples by adding distilled water to the tubes until full, capping, and shaking gently.
Either run the tubes in the centrifuge at low speed, or leave the tubes undisturbed overnight so the diatoms can settle to the bottom before pouring off the H2O2/distilled water mixture, leaving ~10mL in the tube after each rinse. Be careful not to pour out the diatoms at the bottom of the tube! (unlike in the video) Because of the low concentration of H2O2 at this stage, liquid can be poured down a drain.
Repeat the rinsing step 4 more times, and leave 10-20mL of water after the final rinse, depending on how much material you have. You should be able to see the diatoms “sparkle” in the water when you gently shake the tube.
Resuspend the diatoms in the water by shaking gently just before transferring to a slide.
To make permanent diatom slides, students can mount them using corn syrup as a readily available mounting medium, which is less toxic and easier to get than toluene-based mounting mediums such as Naprhax.
Put a few drops of the cleaned diatom solution on a cover slip, and heat on low heat for a couple minutes to evaporate the water.
Put a couple drops of the mounting medium on a clean slide, and flip the diatom coverslip face down on top of the medium.
Heat the slide with the coverslip for a minute on low heat until bubbles are no longer forming under the coverslip.
Remove the slide from heat, and gently press down on the coverslip with tweezers to remove the bubbles as the slide cools.
Identifying and recording diatom populations
Use a pipette to put a droplet of sample on the center of the slide and gently place a coverslip on top of the sample. For living samples, use concave slides so pennate diatoms may be seen moving. For non-living samples, standard slides are fine.
View at low power (10x eyepiece lens X 4x objective lens)
Center diatom(s) of interest and increase to medium or high power magnification
Using a pencil and the microscope drawing worksheet, have students create a detailed drawing of two types of diatoms they observe. Be sure they write down the eyepiece, objective and total magnifications they are using with the drawing.
Many students think they can’t draw but if they are encouraged to simply record what they see and pay careful attention to detail, they may be pleasantly surprised.
Have students count diatoms and fill out their data sheet.
(Optional) Sometimes the size of the diatom is helpful in identifying it. By measuring the diameter of the field of view at low power and using the following formula, specific cell dimensions seen at high power can be determined.
Low power magnification = High power field of view diameter
High power magnification Low power field of view diameter
40 = X
400 low power field of view diameter (in mm.)
Students usually learn how to measure a cheek cell as a routine method. But here, students are learning how to measure a cellular structure e.g. the cell diameter because they need to correctly identify the specific diatom(s) collected.
Explain:
Students attach their diatom drawings to the Hudson River map.
Ask students:
Q. Do the diatom populations coincide with salinity levels at the various locations? If a diatom is found in a location you wouldn’t expect, provide a rationale for it. A. The phytoplankton community floats so, for example, a marine diatom species may be found in a freshwater environment because it was moved by the force of the tide.
Q. Review your results, think through what you had hypothesized. Can you accept or refute it? If so, why? If not, why? A. There needs to be evidence to support acceptance or refusal. Ask students to give examples of evidence, even if the group has not identified many samples.
Extend:
Test the salinity of the water at the site of diatom collection. How do the results compare with your prediction?
Correlate NY DEC fish data with salinity and diatom data (e.g. Menhaden, Atlantic silverside)
Evaluate:
Student responses on Day 2-3 worksheets
Question Diary: Student generates 1-3 questions about diatoms, salinity and other abiotic and biotic factors on a daily basis
Resources
Lesson Files
vnd.openxmlformats-officedocument.presentationml.presentation
Modeling Interaction of Salinity & Diatoms
pdf
Student Worksheet Day 2-3 Identifying Diatoms
pdf
Diatom and Algae ID Cards
Standards
Credits
This lesson was created by teachers Donna Light and Kelly Czermerys