Objectives
Students will know how the application of road salt impacts water quality and be able to discover the different sources of salt as well as the amount of time that salt stays in the aquatic ecosystem.
Overview
Rating:
- Students discuss the implications of salt as a pollutant
- Students work as investigators in groups to discover the impact of different sources of salt
- Each group receives a data set and creates a graph of the information
- Students discuss their findings with the whole class
Materials
- Computers with Excel
- Worksheets
Procedure
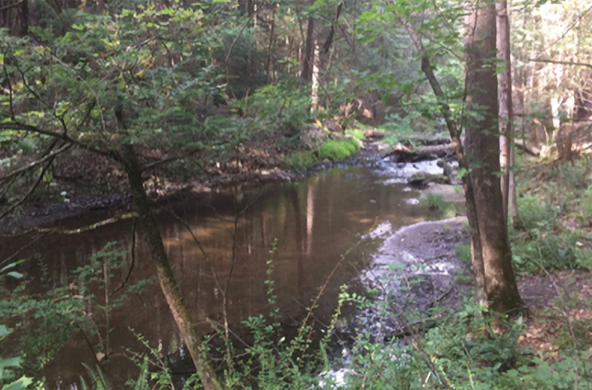
Engage: Remind students what they learned from the previous activity about organism response to salt pollution. How much salt is too much? Ask students if they think it matters whether an organism is exposed to salt for months or years. Remind students of bioaccumulation, and discuss whether salt could be another example of this. This lesson focuses on a small watershed in a relatively unpopulated section of Dutchess County. The stream is part of the Wappinger Creek watershed, which eventually empties into the Hudson River.
Explore: All students begin by understanding land use in Dutchess County, and then focus on the specific watershed for the salt data. First, they make two graphs that show the overview of the amount of sodium and chloride in the river, as well as how much has been exported from the stream each year. Students then "jigsaw" into six separate groups, each looking at a different source of salt pollution: road salt, parking lots, sewage, water softeners, deposition, and weathering. This will allow students to try and identify the source of the salt pollution in the watershed. Students present their results to the rest of the class, and then work to figure out which source of salt has caused the increase.
Explain: Salt has increased steadily in Wappinger Creek since 1986, with some spikes in last 5 years. The primary source is road salt, even though there has not been a significant increase in the use of road salt in the last 9 years. The steady increase is likely due to a lag effect of long-term salt use & subsurface build-up, and the amount of salt in the creek should level off (if there is no increase in road salt use).
Extend: Students could find the averages for five year periods of the amount of salt released from the stream as well as the inputs. This would show students the difference between the beginning of the record and today. Students should be able to tell that earlier in the record, salt was retained in the watershed in groundwater, and once it reached a saturation point, it began to be released.
Evaluate: Students submit their completed worksheets.


