Objectives
Students will know how to estimate flow in a river or stream, and be able to explain how how Hudson River flow is expected to change as predicted by global climate change models.
Overview
Rating:
- Students calculate stream flow at a local waterway
- Using historical data, students compare ‘typical’ flows with storm events
- Students think about the ecosystem impacts of a change in stream or river flow
Materials
- Computers with Excel and internet access
- Meter stick
- Orange
- Measuring tape (best is a 50-100 foot surveyor’s tape)
- Stopwatch or watch with seconds
- Calculator
- Easel or white board to show calculations
Procedure
Preparation:
This exercise requires a trip to a stream or tributary. Students should be familiar with using Excel and calculating averages.
Engage:
Ask students how much water would fit into the classroom. How would they determine this? Allow students to work in pairs to come up with an answer. After discussing their methodologies, show students pictures of various types of rivers and streams.
Ask them to imagine standing on the edge of a stream or river and to think about how much water is going by each second. Then ask them to imagine watching the water flow by in a local stream and the Hudson River. How do these compare?
Explore:
Prepare students for outdoor work.
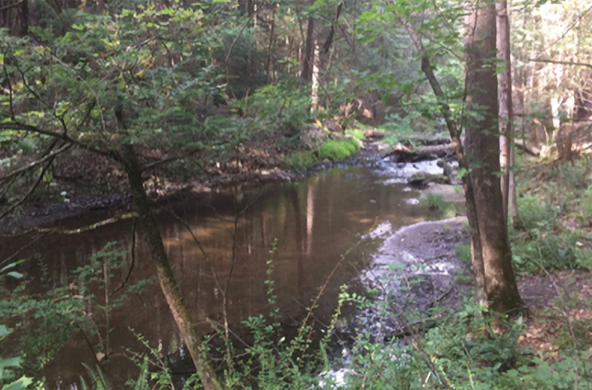
At the stream, take students to the water’s edge and have them observe the movement of the water. Ask students to think about whether they think different kinds of organisms live in low or slow-flow areas versus high or fast-flow areas and why. Then ask students to brainstorm what information they would need to measure the volume of water flowing by. (This is a good chance to refresh their memories about volume.) Introduce the measurement unit ‘cubic feet per second’ (cfs) and ask them what they must measure to find the cfs of water flowing past them in the stream.
Eventually you should get them to the idea that you can think of taking a rectangular slice (width x depth) of the stream and calculating how many slices go past your location in a second. You can get the width and average depth of the stream at your location from student data collection.
In groups, students should complete the attached stream flow worksheet. Make sure students understand the importance of taking several readings and calculating an average.
Students can calculate stream flow back in the classroom.
Explain:
- Ask students why this technique doesn’t work to estimate flow in the Hudson River. Because the Hudson is tidal, velocity measurements are not used to estimate flow. The velocity can actually be negative if the tide is coming in, causing the river to flow backwards. The Native American name for the Hudson is Mahicanituk (muh-hee-kan-tuck), “the river that flows both ways.” The negative flow is outweighed over the course of a tidal cycle by the positive flow, so the overall flow of the river is toward the sea. If students were willing to watch and measure the distance a ping pong ball moved in the river over the course of a tidal cycle, they would see a positive movement downstream. Flow is estimated for the Hudson by adding the freshwater input to the river from the Adirondacks at the Green Island dam together with flow from all of the major tributaries to the Hudson (Esopus, Rondout, Wallkill, Wappinger, etc.). These streams enter the river at different points, so you would only add the stream input from the streams upstream of the point you are measuring. When the students see the historical flow data, they will see that it’s estimated from freshwater input from the river’s watershed upstream from that point.
- After students have their calculations, have them look at their original guesses and see how close they were. Have them compare the numbers with the volume of their classroom.
- Next have the students look at the historic flow rate of the Hudson at Poughkeepsie. How does this compare with the volume flowing past a point in their stream and the volume of their classroom?
- Lastly, plot a trend line on the graph of flow from Poughkeepsie. Are the flows increasing or decreasing?
Extend:
- Have students consider how climate change will impact the Hudson River and nearby streams. Climate change estimates indicate that the Hudson’s flow rate will increase by 20% by 2050. Ask the students to think about the impact on the communities and ecosystems along the river’s edge. Because the Hudson doesn’t have a flood plain, this increase in freshwater flow will likely not have an impact. It would, however, have a huge impact on the Mississippi River, for example, because it has a significant flood plain. The Hudson may, however, be impacted by rising sea level combined with increases in freshwater flow and railroad companies are beginning to be concerned that the tracks along the Hudson could be inundated some day.
- Tell your students that the average New Yorker uses about 100-125 gallons of water every single day. Ask them to calculate how many classrooms of water their class’s combined water use is, assuming 100 gallons of water use each day. Next calculate how many classrooms of water 8.25 million New York City residents would use. Compare these numbers to the Hudson River’s flow in high- and low-flow months (See page 3 of the worksheet).
Evaluate:
Collect students’ worksheets and discuss the implications of changing flow on the Hudson River ecosystem (the last few questions on the worksheet).
References:
Palmer, M.A., C.A.R. Liermann, C. Nilsson, M. Floerke, J. Alcamo, P.S. Lake, and N.Bond. 2008. Climate change and the world’s river basins: anticipating management options. Fronteiers in Ecology and the Environment, vol 6.
Resources
Lesson Files
pdf
Student stream flow worksheet


