Use the filter to limit your results.


Objectives
Students will know how the climate of the Hudson Valley has changed over the last glaciation and be able to explain these changes.
Overview
Rating:
Students brainstorm about ecosystems in the past
Using prepared 'soil samples' with 'fossilized pollen,' students determine the climate history of the region
As a class, students reconstruct the history of the last 16,000 years
Materials
- 8 bags of soil with 14 types of confetti (or other materials) organized in the manner described in the lesson document in resources section.
- student worksheet and reading(s)
- tweezers
- paper plates
- sample sediment ‘core’ with visibly different soil layers: can be made out of different kinds of soil in a tennis ball container, graduated cylinder, soda bottle, etc. These layers can represent the exact layers from the activity, or it can be used only as a visual to get students thinking about the concept of soil layers
Procedure
Preparation:
Before class, prepare eight bags of soils with the below mentioned types of confetti. The ratios are approximate. Feel free to use whatever colors of confetti you have on hand, pieces of paper (hole-punch construction paper or laminated colored paper) or other materials to represent the pollen. You can use visibly different soil types for each ‘layer’ with pollen, but this is not necessary. You can also just tell the students that the soil layers might look alike now, but they look different when scientists collect them.
Once you have prepared the zip-loc bags with the soil and confetti, disperse the bags to your groups of students. If you can’t make eight groups, it would be advisable to give one group two layers (probably the simpler layers, ie 2, 3, or 4). Once students have identified the ‘pollen’ based on the charts they have, they will be able to reconstruct the paleoclimate of the Hudson Valley. You can keep the zip-loc bags for future use.
Engage: Show students the sediment core and ask: What do you think we can discover about the history of a place using the sediment layers. Ask: How far into the past can we go? Students will probably think about fossils or the Grand Canyon. Explain that when we collect a sediment core, we are getting a slice of the soil’s layers. There are many differences between layers, including the tiny, fossilized pollen grains found within them. Ask: how can scientists tell what kind of pollen is in a sediment core? Explain that they will become ‘scientists’ to discover the paleoclimate of the Hudson Valley. Another option is to bring in a flower with pollen. They could observe the pollen under a microscope. Remind students of the difference between pollen and spores.
Explore: Distribute the materials to each group of students: one layer (bag with ‘pollen’), tweezers, and a paper plate. Students should sift through their sediment layers and separate out each of the different pollen types. Allow enough time to discover what layer they have and what type of climate may have existed during this period, using the information on their student guide. Once all groups have completed their work, they should compare their results using the chart on their worksheet and complete the class graph. A rough graph of the general temperature changes can be created on the board (put ‘temp’ on the y-axis as warm, cool, and cold and time on the x-axis). This should allow a discussion of the history of climate change in the Valley. Then, show students the two attached graphs of climate change over the last 14,000 years and the last 400 years. Students should now be able to answer all of the questions on their data sheets.
Explain: Scientists are interested in studying the history of climate change in order to understand patterns of change over time. Since each type of pollen has a distinct shape, scientists can find out what plant produced the pollen. By discovering what types of plants lived during each time period, scientists can infer what the climate was like during that time, and even how many of each type of plant lived during that period. They can also draw conclusions about how long it took for different changes to take place. For instance, how long did it take from the last ice age until the appearance of marsh plants? The speed that plant communities migrate into an area can help scientists understand how plants are currently migrating around the world, and what might happen when the temperatures increase in the future. Scientists from Lamont-Doherty have collected pollen samples throughout the Hudson River area, and are continuing to collect samples to create a more complete picture. “Background Reading About Dr. Peteet” available below under “Lesson Resources” contains more information about this effort.
When discussing the pattern of climate change over the last 16,000 years, it might be helpful to give students background on climate change. There are a number of things that can alter the global temperature: changes in the sun’s activity, distance of the sun’s orbit from earth, volcanic eruptions, greenhouse gas emissions (including aerosols, which can provide a cooling effect). However, we know from data that the sun (solar radiation) has been relatively constant in the 20th century, and that greenhouse gases are higher now than at anytime during the last 600,000 years.
Extend: Students can investigate other regions of the world to determine the paleoclimate data. Information can be found at: Climates of the Past (http://bit.ly/11a4PsU). Students could also be led on a guided walk and discuss what a current ‘layer’ would look like. Additional resources are listed below for further exploration.
Evaluate: Students should be able to complete the activity and answer the questions appropriately. Students could also draw or write a story about one layer using what they know from the chart and more research (including information about the animals that have lived in the area).
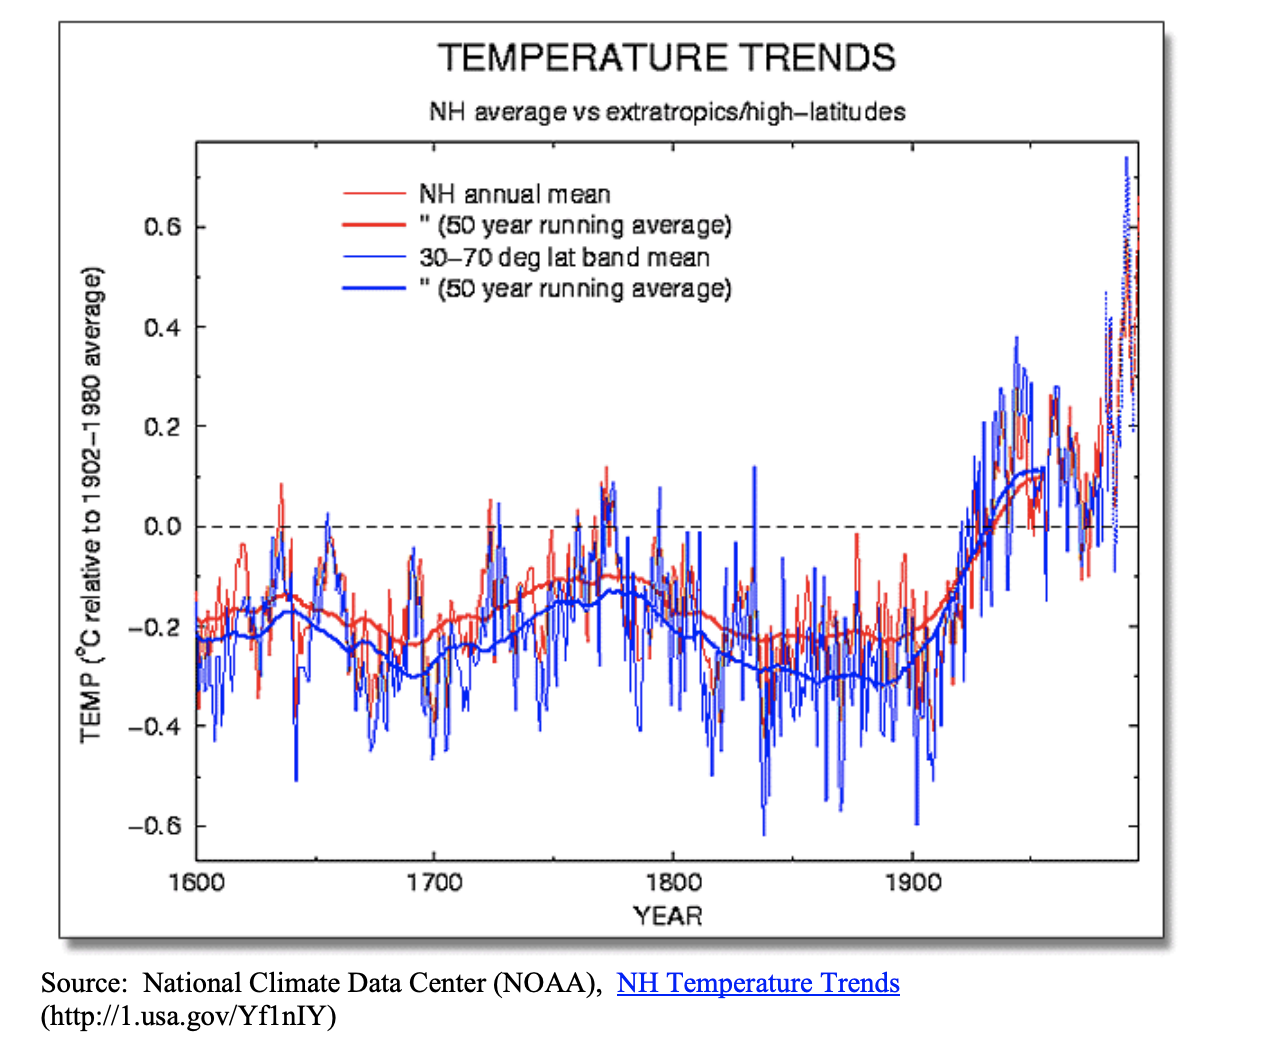
Source: National Climate Data Center (NOAA), NH Temperature Trends (http://1.usa.gov/Yf1nIY)
Source: Viau, A.E., et al. 2006. North American 14,000 Year Pollen-based July Temperature Reconstructions, IGBP PAGES/World Data Center for Paleoclimatology
Resources
Lesson Files
pdf
Background Reading About Dr. Peteet
pdf
Lesson Reading
pdf
Lesson Worksheet
pdf
Supplemental temperature change graphs
pdf
Paleoclimate lesson Plan
Standards
Benchmarks for Science Literacy
1B Scientific Inquiry, 2A Patterns and Relationships, 4B The Earth, 4C Processes that shape the earth, 4G Forces of Nature, 11C Constancy and Change, 12D Communication SkillsNYS Standards
MST 1 - Mathematical analysis, scientific inquiry, and engineering design, MST 4- Physical setting, living environment and nature of science, MST 6- Interconnectedness of mathematics, science, and technology (modeling, systems, scale, change, equilibrium, optimization), MST 7- Problem solving using mathematics, science, and technology (working effectively, process and analyze information, presenting results)Credits
Lesson modified from University Corporation for Atmospheric Research lesson plan,https://www.ucar.edu/ using data from Lamont-Doherty Earth Observatory, for the Changing Hudson Project, Cary Institute of Ecosystem Studies, 2007. Last edit: January 2013.
The text is derived from and based on content from Windows to the Universe® (http://windows2universe.org) © 2010, National Earth Science Teachers Association (http://www.nestanet.org/).
This work is licensed under a Creative Commons Attribution-ShareAlike 3.0 Unported License (http://creativecommons.org/licenses/by-sa/3.0/).