Use the filter to limit your results.


Objectives
Students will know how land use affects water quality and be able to use macroinvertebrates to understand the impact of land use change in watersheds.
Overview
Rating:
- Students select watersheds to study and create hypotheses regarding macroinvertebrates based on observed land use.
- Students obtain aerial photos of the study site and determine the amount of impervious surface in each tested watershed.
- Students complete macroinvertebrate studies at two different sites, look at the pollution tolerance of the invertebrates, and compile and discuss results.
- Students compare their results with published scientific data.
Materials
- Historic and current aerial photos (from website)
- Aerial photos or Google maps of watershed(s)
- Transparency with grid
- Waders or appropriate shoes
- Leaf pack bags (plastic mesh bags for leaf litter)
- Dissecting trays, tweezers, sorting containers to observe benthic material
- Test kits for DO, phosphates, nitrates, pH, chloride and other appropriate tests (optional)
- Goggles, gloves
- Data sheets for macroinvertebrates
Procedure
Prepare:
Aerial photos are a great way for students to compare land use types. Local extension offices or a university GIS department may have maps you can use, although you can also print aerial photos directly from a web application like Google Maps. Depending on the level of your students, you may want to identify the test watersheds ahead of time. Determining watershed boundaries is easy to do using contour lines, which are shown in the terrain feature within Google Maps (the online version, not Google Earth, which does not have contour lines). Google Earth has a tremendous 3D view of terrain, which students can also use to delineate watershed boundaries. Once the watersheds are identified, print them out for students to calculate the different types of land use.
Engage:
Ask students to identify the major land use type in their neighborhood. How does land use change when they drive in different directions? Is land use the same everywhere?
Provide students with the historic and current aerial photos, and ask them to identify the major trends evident in the photos. You can also use the accompanying powerpoint to show pictures of land use from other parts of the country and the world.
Explore:
Students should begin working on their experimental set-up.
1) Students identify test watersheds A & B (unless you do this beforehand).
2) Students determine % land cover of their test watersheds.
3) Students make a prediction, using a provided graph, about the results of a watershed comparison study.
4) Students collect macroinvertebrates. There are a variety of methods for collecting these organisms, which can be found in the accompanying document produced by Hudson Basin River Watch. Alternatively, you can set out leaf packs in the different watersheds and collect them back in 2-3 weeks. For leaf pack methods, visit the Stroud Center’s Leaf Pack website: https://leafpacknetwork.org/ . The Leaf Pack Network has a large range of resources available for use.
5) Students compile their data and identify the numbers of groups that they found in the two different watersheds. Students calculate “species” evenness and richness, although what they’re calculating is actually group evenness and richness, since this lesson does not identify to species level.
6) Students calculate the pollution tolerance levels of each watershed, using the accompanying data sheet.
7) Students graph class data. If you have different watersheds for each student group, you will see a better trend than if the groups all did the same watersheds.
8) Students compare their data with data from other scientific sources.
Explain:
After you return to the classroom, discuss student findings. What did students notice? Ask students to think about the connections between the organisms that live in/near the aquatic ecosystem with the land use in the ecosystem’s watershed.
Urbanization can be a problem for various reasons, since impervious surfaces change the volume and the timing of runoff, and there may be contaminants in the water. In urban areas surface runoff carries pollutants from substances that have leaked or spilled onto the ground, such as oil or salt. Other pollutants such as nitrogen or phosphorus also accumulate in waterways. If you are interested in this topic, have students complete the “Land Use and Water Quality” lesson, which includes data on the increasing amount of nitrogen in suburban waterways. Not only does contamination increase with urbanization, but so does runoff. In many cities and towns, both sewage and rainwater runoff go into a sewage treatment plant. However, heavy storms can cause the sewage system to become overwhelmed. When this occurs, the treatment plant can no longer treat the water, instead releasing all of the water into the nearest water body. This is called a “combined sewage overflow” (CSO). For more information on CSOs, use the “History of Wastewater” reading.
Streams and rivers across the country have been artificially channeled, straightened, or otherwise altered. Construction and/or poor land planning cause excess sediment to wash into streams and rivers, causing them to fill up prematurely, which adds to the threat of flooding. It is normal for streams to flood, so trying to stop them from flooding in one place often increases flooding in another and causes ecological damage to both. Urbanized streams that receive a large amount of water in a short amount of time during a storm are called “flashy” streams.
Macroinvertebrates are an important indicator of the health of an aquatic ecosystem. Immature insects such as stoneflies, mayflies, and water pennies (a type of beetle larvae) require a high amount of dissolved oxygen (DO), while aquatic worms, leeches and pond snails can survive in water with low DO. Oxygen-loving species like mayflies and stoneflies are considered “indicator species,” because they provide important clues about the water they are living in. If you only find animals like leeches, snails, and aquatic worms, then you know that there is a problem with water quality, and you should do additional studies to determine the cause.
One of the most useful water quality indicators is diversity or the number of kinds of organisms. If you find only one or two kinds of animals, no matter what kind they are, you should perform other water quality tests to determine what might be wrong with your aquatic ecosystem. Abnormally low diversity in an ecosystem can indicate a pollution problem or other habitat change that is affecting the ecosystem.
A number of factors besides imperviousness can influence the diversity and density of macroinvertebrates present in an aquatic ecosystem. Seasons, life cycles, types of substrate, food sources, water velocity, and sampling techniques can all affect the diversity of organisms in your sample. For example, if you are testing the water in the spring, you might find fewer animals after a flood or heavy rain.
Further, many larvae emerge as adults in late spring and are present only as eggs during other parts of the year, so it is also important to know the animals’ life cycles. The substrate on the river bottom can affect your results as well. A rocky bottom provides more habitat than a silty or muddy bottom. You should also take into consideration the surrounding habitat: a forest often provides more food (in the form of plant material) than a meadow. Finally, you need to decide what kind of sampling technique you are going to use. A screen or net that is too large will cause you to miss some animals, while inappropriate equipment use means you won’t collect a good sample of all the animals living in the ecosystem.
Extend:
Students can create a presentation of their research for community members or another audience within the school, and discuss ways of improving water quality through land use change or specific mitigation strategies (pervious asphalt, rain gardens, riparian zones, etc).
Evaluate:
Students should be able to calculate the pollution tolerance index of sample data and make a claim about the health of their aquatic ecosystem.
Background information:
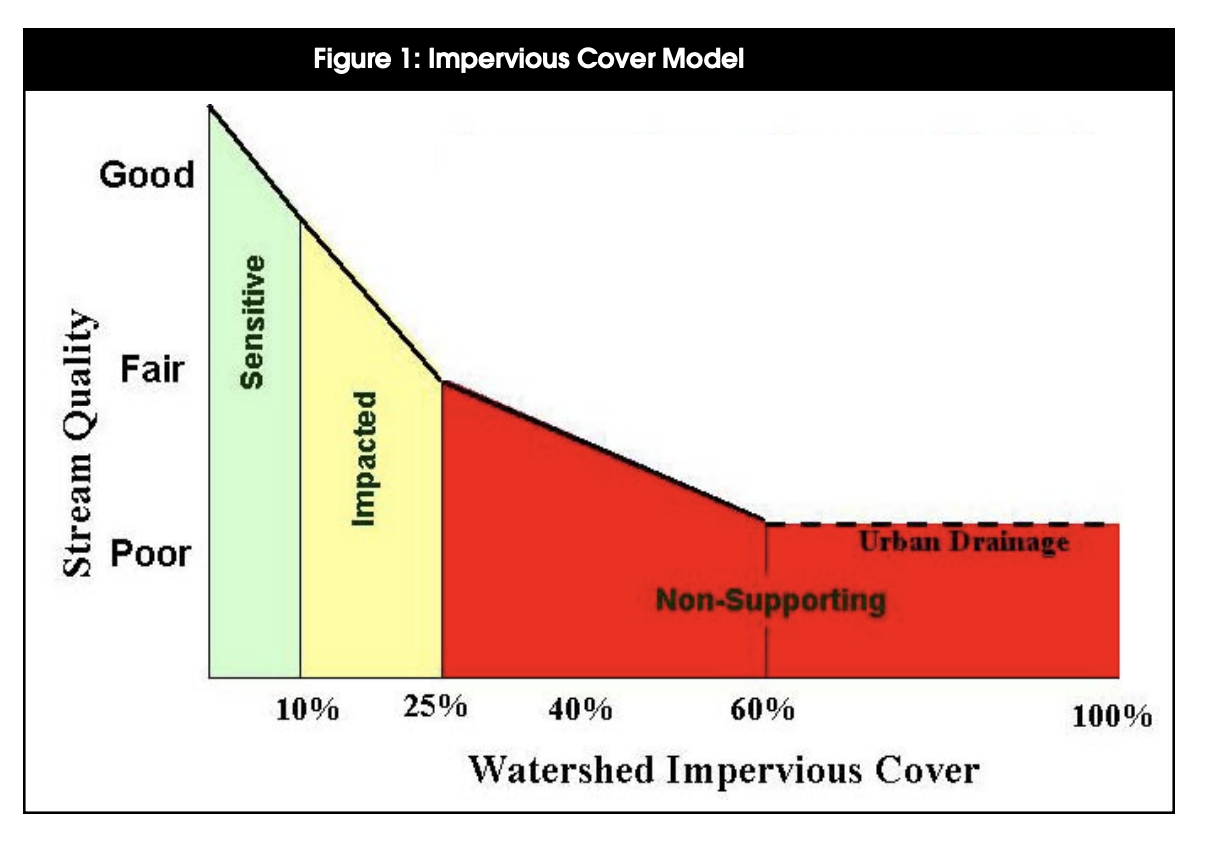
Figure shown is Figure 1 from “The Impervious Cover Model.” The Center for Watershed Protection (http://www.cwp.org; Formerly Stormwater Center): http://bit.ly/18c9bk5
The model classifies streams into one of three categories: sensitive, impacted, and non-supporting. Each stream category can be expected to have unique characteristics as follows:
Sensitive Streams. These streams typically have a watershed impervious cover of zero to 10 percent. Consequently, sensitive streams are of high quality, and are typified by stable channels, excellent habitat structure, good to excellent water quality, and diverse communities of both fish and aquatic insects. Since impervious cover is so low, they do not experience frequent flooding and other hydrological changes that accompany urbanization. It should be noted that some sensitive streams located in rural areas may have been impacted by prior poor grazing and cropping practices that may have severely altered the riparian zone, and consequently, may not have all the properties of a sensitive stream. Once riparian management improves, however these streams are often expected to recover.
Impacted Streams. Streams in this category possess a watershed impervious cover ranging from 11 to 25 percent, and show clear signs of degradation due to watershed urbanization. The elevated storm flows begin to alter stream geometry. Both erosion and channel widening are clearly evident. Streams banks become unstable, and physical habitat in the stream declines noticeably. Stream water quality shifts into the fair/good category during both storms and dry weather periods. Stream biodiversity declines to fair levels, with most sensitive fish and aquatic insects disappearing from the stream.
Non-Supporting Streams. Once watershed impervious cover exceeds 25%, stream quality crosses a second threshold. Streams in this category essentially become conduits for conveying stormwater flows, and can no longer support a diverse stream community. The stream channel becomes highly unstable, and many stream reaches experience severe widening, downcutting, and streambank erosion. Pool and riffle structure needed to sustain fish is diminished or eliminated and the substrate can no longer provide habitat for aquatic insects, or spawning areas for fish. Water quality is consistently rated as fair to poor, and water recreation is no longer possible due to the presence of high bacterial levels. Subwatersheds in the non-supporting category will generally display increases in nutrient loads to downstream receiving waters, even if effective urban BMPs are installed and maintained. The biological quality of non-supporting streams is generally considered poor, and is dominated by pollution tolerant insects and fish.
Resources
Lesson Files
pdf
Macroinvertebrate Powerpoint
pdf
Data Sheet
pdf
Macroinvertebrate ID Sheet
pdf
Key with Pictures
pdf
Key without Pictures
pdf
Macroinvertebrate Collection Sheet
pdf
Common Invertebrates of the Hudson ValleyStandards
Benchmarks for Science Literacy
1B Scientific Inquiry, 2A Patterns and Relationships, 4B The Earth, 5A Diversity of Life, 5D Interdependence of Life, 11C Constancy and Change, 12A Values and Attitudes, 12B Computation and Estimation, 12C Manipulation and Observation, 12D Communication Skills, 12E Critical-Response SkillsNYS Standards
MST 1 - Mathematical analysis, scientific inquiry, and engineering design, MST 3- Mathematics in real-world settings, MST 4- Physical setting, living environment and nature of science, MST 6- Interconnectedness of mathematics, science, and technology (modeling, systems, scale, change, equilibrium, optimization), MST 7- Problem solving using mathematics, science, and technology (working effectively, process and analyze information, presenting results)Credits
References:
Behar, S. and M. Cheo. 2004. Hudson Basin River Watch Guidance Document. River Network. https://catskillstreams.org/pdfs/guidancedoc.pdf
Center for Watershed Protection website: https://www.cwp.org/
Groffman, P., Law, N., Belt, K., Band, L., and G. Fisher. 2004. Nitrogen Fluxes and Retention
in Urban Watershed Ecosysetms. Ecosystems 7:393-403.
Limburg, K.E. & R.E. Schmidt. 1990. Patterns of Fish Spawning in Hudson River Tributaries:
Response to an Urban Gradient? Ecology, 71(4): 1238-1245.
Morgan, R.P, & S.F. Cushman. 2005. Urbanization effects on stream fish assemblages in
Maryland. Journal of North American Benthological Society, 24(3):643-655
Schueler, T. R. & H.K. Holland, eds. 2000. The Importance of Imperviousness. Watershed
Protection Techniques, 1(3): 100-111.
Wang, L. and P. Kanehl. 2003. Influences of Watershed Urbanization and Instream Habitat on Macroinvertebrates in Cold Water Streams. Journal of the American Water Resources Association, 39(5): 1181-1196.