Use the filter to limit your results.


Objectives
Students will know the concept of biomagnification and be able to explain how biomagnification relates to cadmium levels in blue crabs in the Hudson River.
Overview
Rating:
- Students will learn about biomagnification through a reading activity, video, and a PowerPoint presentation.
- Students will represent the process of cadmium biomagnification in a drawing, poster, or a mobile.
Materials
- Copies of reading and questions “Biomagnification: Cadmium in the Food Web”
- PowerPoint for Lesson 3, “Biomagnification” and “Biomagnification PPT Notes for Teachers”
- Dice or spinner, one for each group (spinners can be made using the masters at the end of the lesson plan)
- Video clips – two short videos illustrate biomagnification in different ways: a slow, quiet version, “Bioaccumulation of Pollution in Waterways” or a fast version with loud jazzy music “Biomagnification!”.
- Supplies for the biomagnification poster or mobile. See the Resources file “Biomagnification Mobile Instructions and Materials” for details and sample images for the mobile.
- Copy animals for making the mobile or poster per student group: 2 blue crab pictures, up to 12 grass shrimp pictures, and up to 36 mud worms pictures, and beans or other small items to represent cadmium.
- For posters: Large sheets of chart paper or butcher paper, one per group
- For mobiles: see materials listed in the accompanying file
Procedure
Prepare materials for either the mobile or poster.
Engage
Students should complete the “Biomagnification” reading and questions either in class or as homework prior to the lesson. Prompt or formative assessment: Ask students to use the concept of biomagnification to answer this question: Why would a top predator such as a striped bass have higher levels of PCBs than zooplankton?
Students should be able to explain that as the larger striped bass eats many smaller contaminated organisms, it will accumulate more PCBs since it is ingesting all of the PCBs in the bodies of the smaller organisms.
Explore
Show the PowerPoint presentation entitled “Biomagnification.” During the presentation, you will be prompted to show two short videos listed in the Materials section above and included in the “Biomagnification” PowerPoint. However, since the videos are on YouTube, you may have to download them in advance of class. Both videos are short, one to two minutes long. As student watch, ask them to pay attention to the pathway of the toxin, from primary producer to top predator.
Distribute the materials for groups to make posters or mobiles. Each group will start with one blue crab, and then create a biomagnification food chain to see how many “units” of cadmium each crab has in its body. Note that “unit” is not a real measurement for cadmium, but is used here for convenience. Ask students to suggest how many grass shrimp each crab would eat, based on the idea of energy flow in ecosystems (10% rule). Students should realize that they would have to have 10 shrimp, 100 mud worms, and 1000 detritus bits for each crab. Since that isn’t realistic, simplify the numbers and choose a set number of grass shrimp, mud worms, detritus bits, and cadmium units for each food chain. Choosing numbers between 2 and 5 can keep the food chains from becoming too cumbersome. Another option is to have students use dice or spinners to decide how many grass shrimp, etc.
Students can draw or add arrows pointing to the crab from the shrimp –arrows should point towards the organism getting energy, nutrients, and cadmium from its prey. Once students have added all organisms and cadmium to their poster or mobile, they should calculate how many units of cadmium each organism contains and label their work.
Explain
An important process through which chemicals can affect living organisms is biomagnification. Biomagnification means that the concentration of a chemical increases in a biological organism over time, compared to the chemical's concentration in the environment. Compounds accumulate in living things any time they are taken up and stored faster than they are broken down (metabolized) or excreted.
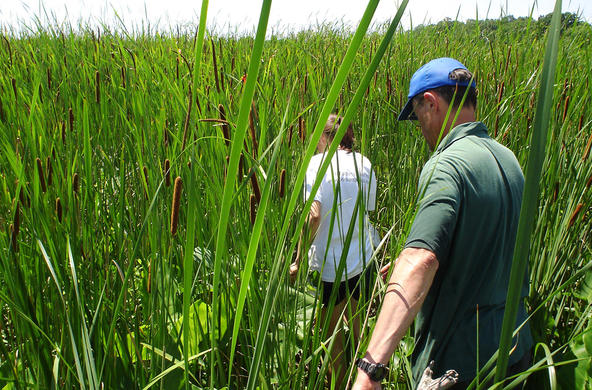
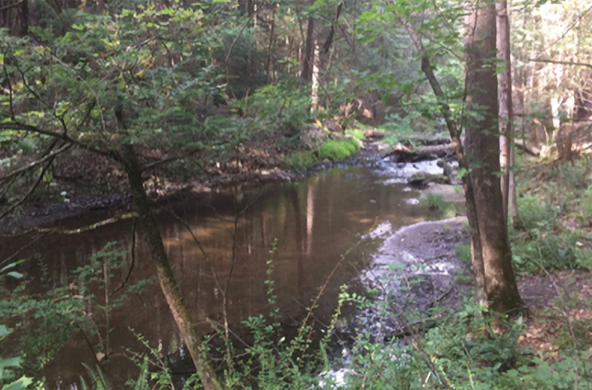
In Foundry Cove, cattails take up cadmium. Cattails die each fall and break down into cadmium-containing detritus eaten by the mudworm (Limnodrilus hoffmeisteri) as well as other benthic organisms. The mudworms from Foundry Cove had higher levels of cadmium in their tissues than did mudworms from the control site, South Cove. Studies showed that most of the cadmium in the worms was stored in a biologically unavailable form, metal-rich granules, though some was stored in an available form, metallothionein (MT). Bioaccumulation of cadmium in grass shrimp was due to the fact that the shrimp absorbed the MT form of cadmium.
Researchers found that bioaccumulation of cadmium occurred in grass shrimp that ate worms from Foundry Cove, but did not occur in grass shrimp that ate worms from the control area.
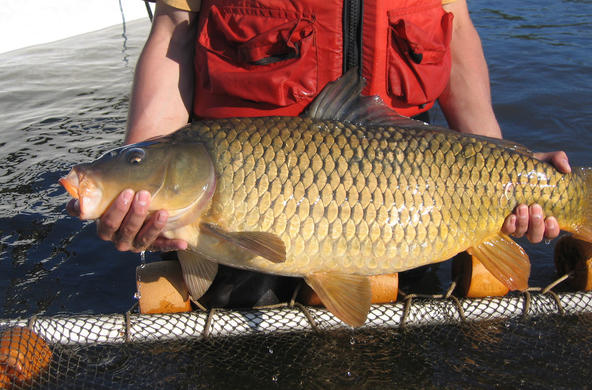
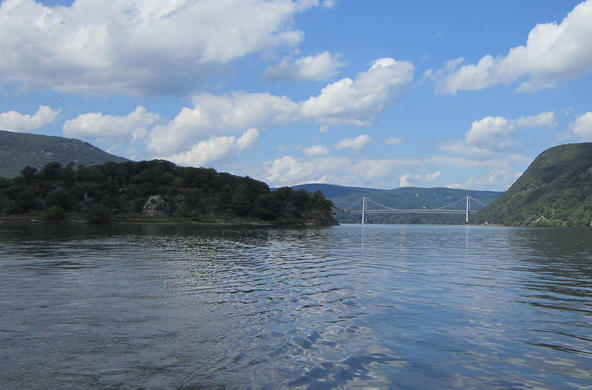
One of the cadmium pathways discussed in the previous lesson is due to tides, which carry cadmium out into the Hudson River. Blue crabs may move in and out of Foundry Cove with the tides, and may eat contaminated organisms while in the cove or in the Hudson River.
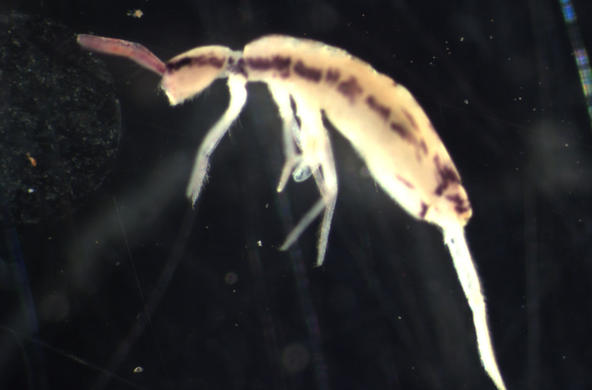
Grass shrimp are brackish water animals and therefore rarely found in Foundry Cove. They are occasionally seen there during times of unusually low rainfall when the salt front in the Hudson River moves north to the cove.
Even though grass shrimp are rare predators in the Foundry Cove, they were chosen for the activity because they eat L. hoffmeisteri mud worms, and scientific studies had shown biomagnification of cadmium occurs from eating the worms.
Two short videos that show predation behavior: a blue crab eating a shrimp (http://bit.ly/10x4NMq) and “Dinner time: Crab vs. Clam" https://www.youtube.com/watch?v=Hv7dDY43WxM
Extend
- Students can create their own videos showing bioaccumulation.
- Students can conduct research on DDT, PCBs, mercury, or other toxins that exhibit biomagnification in food webs.
Evaluate
Ask students to use the concept of biomagnification to write, diagram, or illustrate the process of bioaccumulation in a food chain.
Resources
Lesson Files
pdf
Biomagnification: mobile instructions and materials
pdf
Biomagnification: PowerPoint notes for teachers
pdf
Biomagnification: PowerPoint presentation
Standards
Benchmarks for Science Literacy
1B Scientific InquiryNYS Standards
MST 3- Mathematics in real-world settings, MST 4- Physical setting, living environment and nature of science, MST 6- Interconnectedness of mathematics, science, and technology (modeling, systems, scale, change, equilibrium, optimization)Credits
Celia Cuomo, Cary Institute