Use the filter to limit your results.


Objectives
Students will know how Foundry Cove became the most cadmium-polluted place in the world and will be able to explain the impact on the ecosystem.
Overview
Rating:
- Students view a PowerPoint presentation to learn how toxic contaminants entered Foundry Cove.
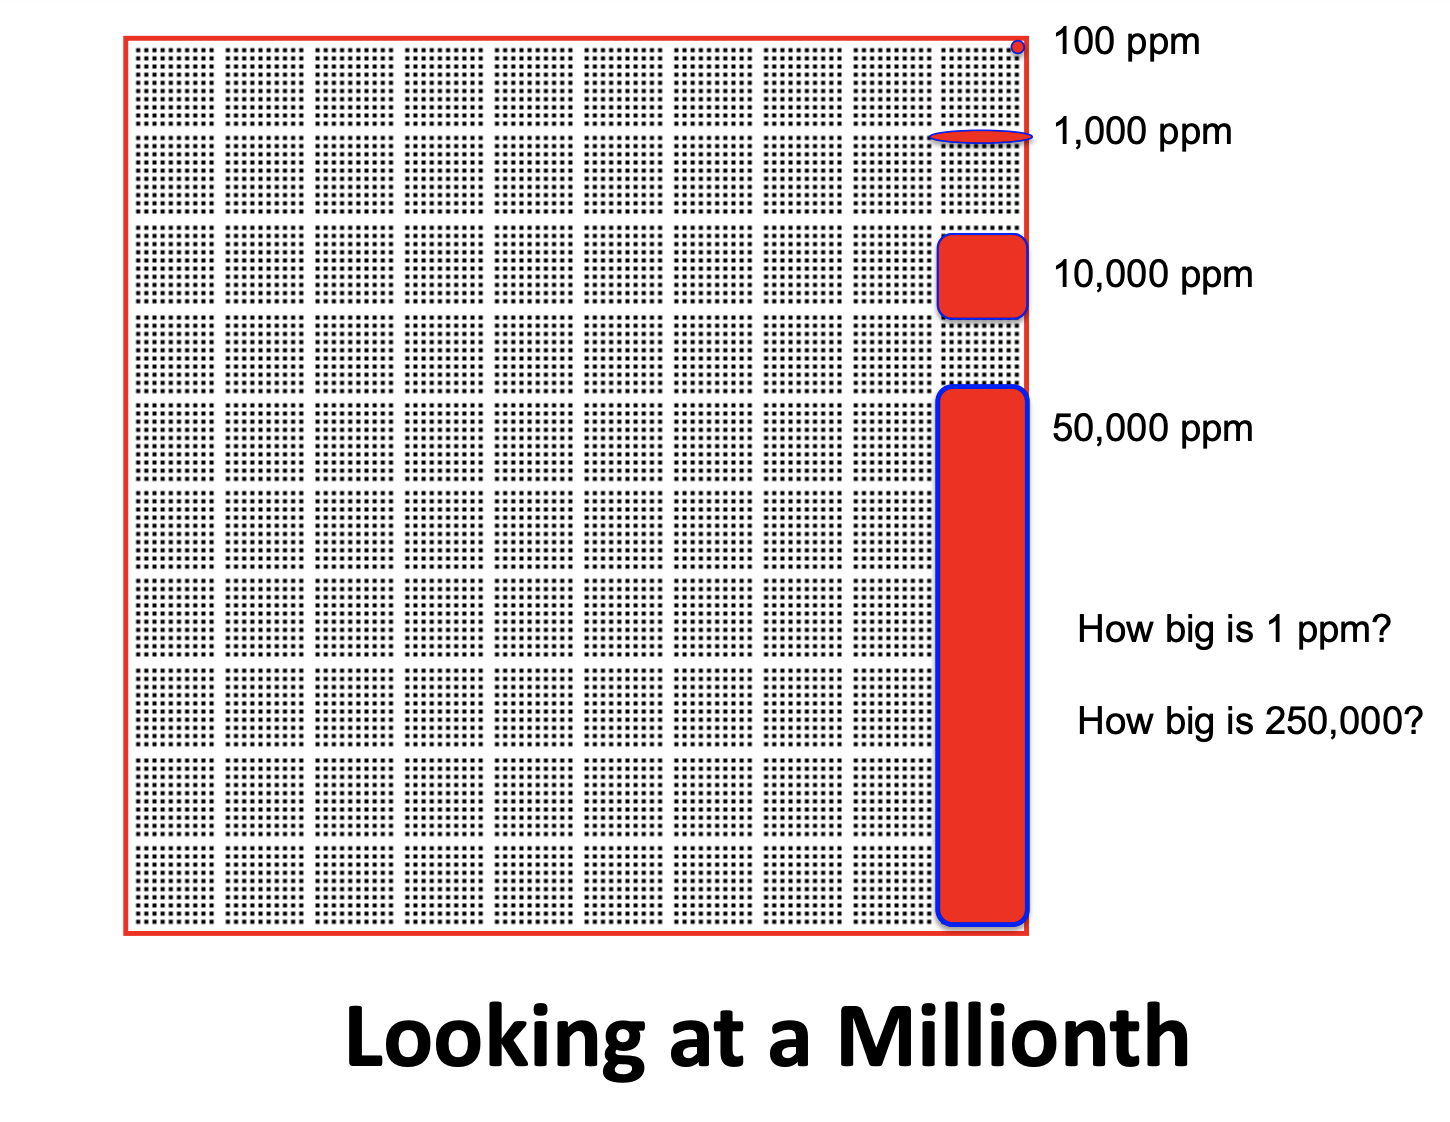
- Students conduct a serial dilution, “Looking at a Millionth”.
Materials
- PowerPoint presentation “The Marathon Battery Story” and “Marathon PPT Notes for Teachers”s
- Copies for students: “Contaminated Fish Reading”, “Contaminated Fish Reading Questions” and “Marathon Battery Activity Worksheet”
- Red or blue food coloring
- Red and blue color pencils
- Spot plates with at least seven wells, one per pair
- Dropper, one per pair
- Grease pencils
- A beaker with diluted food coloring, for 10,000 ppm (or 1%), mix 5 ml food coloring and 495 ml water
- “Million Dots” poster, optional (available for purchase online, search for “Million Dots Poster).
Procedure
Preparation
In a large beaker or graduated cylinder, make a mixture of food coloring and water with a known volume of water and known number of drops of food coloring to use during the Engage portion of the lesson. You want to be able to see that the water is colored.
Procedure
Engage
Show students the beaker you have prepared with diluted food coloring and ask them to estimate how many drops of food coloring are in the beaker.
Ask: How much more water do you think you can add and still see the color? Tell students that today they will find out just how much a “part per million” is.
Explore
Have students read the “Contaminated Fish” article from the Sunday, June 13, 1971 edition of the New York Times (available below in the Related Readings section) and answer the questions on the accompanying handout or verbally review the answers.
- Use the PowerPoint presentation (with accompanying teacher notes) to extend the reading, adding detail to the story through photos, diagrams and additional information.
- Complete the “Serial Dilution Activity” to help students visualize what a “part per million” looks like.
Explain
Article: Foundry Cove is significant not only because of the amount of contamination that accumulated, but also because it was the first site where heavy metal contamination caused fish to be unfit for human consumption.
Story/Powerpoint: The Foundry Cove area contains an archeological site as well as the site of cadmium pollution. A foundry uses molten metals to cast machinery and other metal items. The cove gets its name from the nearby West Point Foundry that manufactured parts for steam engines and Parrott guns (shown in the photo) used by the Union Army during the Civil War. Relics from this era remain at the site, and archeological digs conducted during the summer continue to unearth more historical finds. The photos also depict a 2007 archeology crew from Michigan and furnace remnants they uncovered – notice the shovel for scale. Initially, Marathon Battery Factory made batteries for Nike missiles, but later converted to making batteries for general use. Nickel-Cadmium batteries continue to be used for some applications, though they are no longer manufactured at Foundry Cove. Current uses include: cordless and wireless telephones, emergency lighting, remote controlled model airplanes, and cordless power tools.
When the Marathon Battery Factory began dumping wastes in Foundry Cove (and for a short time into the Hudson through the Cold Spring sewage plant), the Clean Water Act and the Environmental Protection Agency did not exist. The EPA was established in 1970, and the Clean Water Act was passed in 1972.
Activity: The final slide illustrates parts per million, which will lead into the dilution activity. If you have a Million Dots poster, this is a good time to direct students’ attention to it. Ask them to show the area (how many dots) equal to levels of cadmium contamination in the Foundry Cove: 1000; 3000; 50,000; 250,000. This last number is the highest level of contamination ever found in the world, and was found by researches right at the discharge site. More advanced students can show the area of 39,500, the high contamination level shown on the 1983 map.
Explore
Distribute the “Marathon Battery Activity” worksheet to students and explain that the dilution activity will give them the opportunity to create and see different concentrations of food coloring to help them visualize and understand parts per million. In addition, students are presented with an opportunity to understand that just because you can’t see something doesn’t mean it’s not there. In fact, many forms of pollution are not visible but are still harmful or toxic to people, other organisms, and the environment. Cadmium is just one such example. In pairs, have students conduct the serial dilution activity, “Looking at a Millionth” as directed on their handouts. They will begin with 10 drops of food coloring in well #1 and nine drops of water in wells #2-7.
Answers to Extension questions from the Worksheet:
a. ppm are shown above
b. Three more test tubes are needed to get a solution that has one part per billion of food coloring.
c. One way to make 50,000 ppm (5%) solution is to use one drop of food coloring and 19 drops of water. Students may come up with other methods.
Extend
Ask students to find the use of parts per million as a measure of contamination in the news. PCBs in the Hudson River and carbon dioxide in the atmosphere are two prominent ongoing stories that rely on this unit of measure.
Evaluate
Questions 4 and 5 on the activity handout can be used to assess students’ understanding of parts per million and how it applies to contamination in Foundry Cove.
Resources
Lesson Files
pdf
Marathon Battery PowerPoint
pdf
PPT Teacher Notes
pdf
Student Worksheet: Serial Dilution Activity
Standards
Benchmarks for Science Literacy
2A Patterns and Relationships, 5D Interdependence of Life, 9A Number, 12B Computation and EstimationNYS Standards
MST 1 - Mathematical analysis, scientific inquiry, and engineering design, MST 4- Physical setting, living environment and nature of science, MST 6- Interconnectedness of mathematics, science, and technology (modeling, systems, scale, change, equilibrium, optimization), MST 7- Problem solving using mathematics, science, and technology (working effectively, process and analyze information, presenting results)Credits
Celia Cuomo, Cary Institute.