


The forest is playing a symphony. By tapping into environmental monitoring sensors at the Hubbard Brook Experimental Forest in the White Mountains of New Hampshire, a tool called WaterViz captures a real-time audio visualization of the forest’s water cycle.
Each day, sensors at Hubbard Brook record more than 90,000 points of data. This information is transmitted to the internet, where a process called sonification lets listeners “hear” rainfall, stream flow, soil moisture, evaporation, transpiration, and other environmental attributes. Four days of data is compressed into a nineteen-second symphony, which is created by mapping water data elements to musical instruments.
You can tune into the music of the forest by visiting the Hubbard Brook Listen Live radio station. The same musical phrase repeats until new hourly data are uploaded to the station and the oldest hour is dropped. Listeners can also use WaterViz to play weather events from the last 5 years, including Tropical Storm Irene.
Led by the U.S. Forest Service, WaterViz melds science, visual arts, music, and information design. By turning watershed data from an experimental forest in New Hampshire into music, listeners can experience the dynamic, fluid, flowing nature of hydrologic processes.
The project strives to engage a broader community of learners in science and data literacy. WaterViz lessons have been developed for middle and high school science teachers. The tool makes environmental data accessible to auditory learners and students that might not be inspired by numeric presentations of data.
Produced in collaboration with WAMC Northeast Public Radio, this podcast originally aired on January 8, 2016. To access a full archive of Earth Wise podcasts, visit: www.earthwiseradio.org.
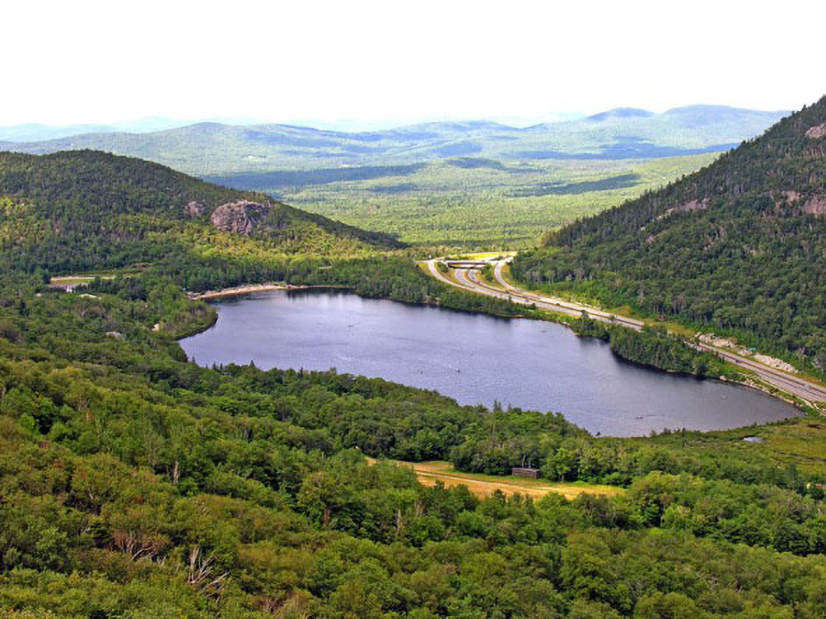
Photo courtesy of Dennis Jarvis via Flickr.


